Download

1 / 7
70 likes | 191 Views
Learn about dispersion in statistics - how data spreads out in a set, and how variance and standard deviation help measure this. Discover the importance of these concepts and step-by-step calculator instructions to find them.

E N D
Dispersion of Data….Variance and Standard Deviation *Carefully follow all instructions to successfully complete this section
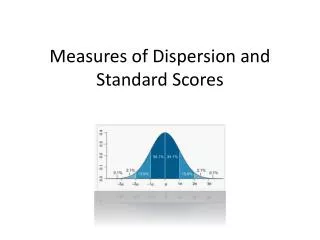
Write the following notes on dispersion of data What does dispersion in statistics mean? Dispersion means how spread out the data is in a data set. In other words, how much of the data is close to or far away from the mean or average. Remember….so far, we have discussed how to find one number that represents the data (measure of central tendency) as well as different ways to display data…box and whisker plots, frequency tables and histograms.
What are two ways we can determine dispersion? By finding the variance and standard deviation. • Deviation just means how far from the normal • The Standard Deviation is a measure of how spread out numbers are. • Its symbol is σ (the greek letter sigma) • The formula is easy: it is the square root of the Variance. So now you ask, "What is the Variance?“ • The Variance is defined as: • The average of the squared differences from the Mean. • To calculate the variance follow these steps: • Work out the mean then for each number: subtract the Mean and square the result. Then work out the average of those squared differences.
Finding variance and standard deviation can be A LOT of work so let’s use our calculator to find them.
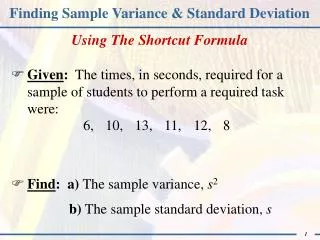
Calculator steps to find the variance. Calculator steps to find the variance: • First, you must type the data values into the calculator to do this, use the following calculator steps: STAT, ENTER and then type the data values into L1. • Second, you must go to the catalog to find the variance. The calculator steps to do this are: 2nd, 0 and then scroll down to the word Variance. • Third, you are finding the variance of the data you put into L1 so you hit the 2nd button and then 1. Enter. • This is the variance.
We have learned how to find the variance….now let’s learn how to find the standard deviation. If you can find the variance, finding the standard deviation is EASY!!!!
Calculator steps to find the standard deviation. • First, find the variance • Second, find the square root of the variance. • This is the standard deviation!!!!