Download
1 / 38
390 likes | 613 Views
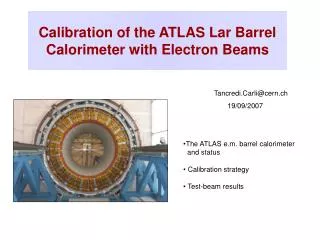
Calibration of the ATLAS Lar Barrel Calorimeter with Electron Beams. Tancredi.Carli@cern.ch. 19/09/2007. The ATLAS e.m. barrel calorimeter and status Calibration strategy Test-beam results. The ATLAS Calorimeter. LAr Calorimeters: em Barrel : (| |<1.475) [Pb-LAr]

E N D
Calibration of the ATLAS Lar Barrel Calorimeter with Electron Beams Tancredi.Carli@cern.ch 19/09/2007 • The ATLAS e.m. barrel calorimeter • and status • Calibration strategy • Test-beam results
The ATLAS Calorimeter • LAr Calorimeters: • em Barrel : (||<1.475) [Pb-LAr] • em End-caps : 1.4<||<3.2 [Pb-LAr] • Hadronic End-cap: 1.5<||<3.2 [Cu-LAr] • Forward Calorimeter: 3.2<||<4.9 [Cu,W-LAr] • ~190K readout channels • Hadronic Barrel: Scintillating Tile/Fe calorimeter
Physics Requirements Discovery potential of Higgs (into γγ or 4e± ) determines most requirements for em calorimetry: • Largest possible acceptance ( accordion, no phi cracks) • Large dynamic range : 20 MeV…2TeV ( 3 gains, 16bits) • Energy resolution (e±γ): E/E ~ 10%/√E 0.7% precise mechanics & electronics calibration (<0.25%)… • Linearity : 0.1 % (W-mass precision measurement) presampler (correct for dead material), layer weighting, electronics calibration • Particle id: e±-jets , γ/π0(>3 for 50 GeV pt) fine granularity • Position and angular measurements: 50 mrad/√E Fine strips, lateral/longitudinal segmentation • Hadronic – Et miss (for SUSY) • Almost full 4π acceptance (η<4.9) • Jet resolution: E/E ~ 50%/√E 3% η<3, and E/E ~ 100%/√E 10% 3<η<5 • Non-compensating calorimeter granularity and longitudinal segmentation very important to apply software weighting techniques • Speed of response (signal peaking time ~40ns) to suppress pile-up
The E.M. Barrel ATLAS Calorimeter Lead/Liquid Argon sampling calorimeter with accordion shape : back >22 X0 middle Main advantages: LAr as act. material inherently linear Hermetic coverage (no cracks) Longitudinal segmentation High granularity (Cu etching) Inherently radiation hard Fast readout possible strips Presampler in front of calo up to = 1.8
EM Barrel: Wheels Insertion P3 M-wheel inside the cryostat, March 2003
EM Barrel: Wheels Insertion P3 ATLAS barrel calorimeter being moved to the IP, Nov. 2005
EM Barrel: Wheels Insertion P3 ATLAS endcap calorimeters installation, winter-spring 2006
Commissioning – The Road to Physics 1: Testbeams 2: Subdetector Installation, Cosmic Ray Commissioning ~30 k events in barrel Sommer ’07: Global cosmic run with DAQ of ATLAS detector >03/07 weekly cosmic data taking together with Endcap A ~100 k events 3: First LHC collisions 4: First Physics 2005 2006 2007 2008 Final cool down
Test beam Setups Test-beam 2002: Uniformity: 3 production modules h/f scan Linearity: E-scan 10 -245 GeV at eta=0.69 phi=0.28 thanks to special set-up to measure beam energy: linearity of beam energy known to 3 10-4 and a constant of 11 MeV (remnant magnet field) Test-beam 2004 : (not covered here) Combined test beam full slice of of ATLAS detector final electronics+ DAQ
Optimal Filtering Coefficients ADC MeV conversion ADC to GeV Pedestals response to current pulse pedestals and noise • All cells are pulsed with a known current signal: • A delay between calibration pulses and DAQ is introduced • The full calibration curve is reconstructed (Δt=1ns) • Cells are read with no input signal to obtain: • Pedestal • Noise • Noise autocorrelation (OFC computation) F = ADC2DAC DAC2A A2MeV fsamp Energy Raw Samples • Scan input current (DAC) • Fit DAC vs ADC curve with a second order polynomial, outside of saturation region Amplitude ( Energy) Pedestal subtracted The ionization signal is sampled every 25 ns by a 12 bits ADC in 3 gains. Energy is reconstructed offline (online in ROD at ATLAS). LAr electronic calibration Every 8 hours Every change of cabling Every 8 hours
Shower On the Calibration of longitudinally Segmented Sampling Calorimeter Samp.frac. depends on shower composition. Many short-ranged, low-energy particles are created and absorbed in the Pb (much higher cross-section for photo-electric effect in Pb than LAr) Sampl. fract. decreases with depth and radius as such particles become more and more towards the tails of the shower Use one sampling fraction for all compartments apply energy dependent correction
Sampling Fraction Correction 1% Correction to sampling fraction in accordion: - intrinsic E-dependence of s.f. - I/E conversion - out-of-cluster (fiducial volume) correction
Cryostat Walls e- Accordion Calorimeter Presampler Correction for Dead Material Losses • Accordion Sampling Calorimeter • Segmentation in three longitudinal compartments • Presampler • (Significant) amount of dead material upstream (~2-3 X0) • Cryostat wall, solenoid, … Material in front of the Accordion in ATLAS • Calibration Strategy: • Use MC to understand effect of upstream material • Validate MC with test-beam data • Derive calibration constants from MC • Cross-check by applying calibration to test-beam.
DM Correction using the Presampler I Assume for a moment perfectly calibrated Lar calorimeter: Opt. Linearity Opt. Resolution A simple weight is not sufficient!
DM Correction using the Presampler II e+ Shower e- e- Dead Material Dead Material Accordion Presampler Sampling fraction for PS can not be calculated as for sampling calorimeter • Slope is smaller: • Secondary electrons: • only traverse part of dead material • are created in PS • are backscattered from calorimeter • Offset not zero: • In the limit of hard Bremsstrahlung, no electron • traverses the pre-sampler
DM Correction using the Presampler II e+ e- e- Dead Material Dead Material Presampler Offset accounts for energy loss by particles stopping before PS - Ionisation energy loss - low-E Bremsstrahlung photons - photo-photonuclear interactions Weight accounts for energy loss (partly) traversing the DM and the PS energy dependent
e+ e- e- Dead Material Dead Material Presampler DM Correction between PS and Strips • Significant amount of inactive material (~0.5 X0) • Electronics boards and cables immersed in LAr • Dependence on impact point • Shower already developed (about 2-3 X0 before Accordion) • Best correlation between measured quantities and energy deposit in the gap: • Empirically found
Final Calibration Formula Slope: energy lost by particles produced in DM (seeing effectively a smaller amount of dead material) in front of calorimeter Correction to sampling fraction in accordion: - intrinsic E-dependence of s.f. - I/E conversion - out-of-cluster correction Offset: energy lost by beam electron passing dead material in front of calorimeter +Eleak e+ Shower e- e- Dead Material Dead Material Presampler Accordion • Good linearity and resolution achieved • Constants depend on impact point (upstream material) and on the energy. • Can be parameterized. • Constants are derived from a MC simulation of the detector setup.
Data MC Comparison – Layer Energy Sharing Most difficult: correct description of DM material Band due to uncertainties in material estimation
Data MC Comparison – Layer Energy Sharing Mean visible energy for245 GeV e- Deposited energies = f(h) in the PS and in the 3 calorimeter compartments before applying the correction factors a,b,c,d Excellent Data / MC agreement in all samplings Data MC PS Strips Middle Back h
Data/MC Comparisons – Radial Extension First layer: MC uncertainty shown but not visible • We do not know why this • Is, can be • detector geometry ? • beam spread ? • cross-talk • G4 physics problem ? • Good description • also for asymmetry
Data/MC Comparisons – Total Energy Distribution Need to fold in acceptance correction for electrons having lost large energy in „far“ material (from beam-line simulation) MC uncertainty contains variation of „far“ material: air in beam-line and beam-pipe windows
Linearity Result within 0.1% for 15-180 GeV, E=10 GeV 4 per mil too low, reason unclear…
Systematics ..within 0.1%
Resolution Result Good resolution while preserving good linearity
Data MC comparison - Resolution Preliminary Phi-impact correction not applied Resolution is much better described in new G4 version ! G4.8 has completely revised multiple-scattering
Current to Energy Factor in ATLAS Barrel EM Calorimeter G. Unal: ATLAS-SIM 09/05 Assuming calo is simple condensator and knowing Lar drift time: From calculation using field-Maps: Pb absorber electrode From comparison of data and MC: Much better understanding of absolute energy scale from first principles ! (Some effects missing in simulation and calculation,e.g. recombination effect in Lar)
, , Calibration Parameter vs Eta E=245 GeV e-, scan in h Internal ATLAS modul number related to h
Uniformity barrel results Module P15 Module P13 245.6 GeV 245.7 GeV Uniformity 0,44% 0,44% 0,7-0,9% 0,7-0,9% Resolution TDR requirement: 0.7%
Conclusion • Precise calibration of em calorimeter need to take em physics effects • - variation of sampling fraction with depth energy • - dead material correction • This is only possible using a MC and requires excellent description by MC • As an alternative calibration parameters can be extracted using a fit • (based on correct functional form of calibration formula) • In ATLAS presently both strategies are followed • In the test-beam it has been demonstrated: • MC describes data well • Calibrations parameters extracted from MC, lead • to linearity of 0.1% and optimal resolution (~10% 1/sqrt(E)) • - 0.44 % global uniformity over one module (shown for 2 modules) • MC-based calibration presently extended to hadron calibration • Challenging since MC much less reliable
Upstream fraction vs E,eta • Accordion: 24.5 X0 thick • Impact point: • =0.4, =0
Calibration Constants - 2004 RunDependence on upstream material • All parameters rise when material is added • More energy lost upstream, later part of the shower is measured.
Sensitivity to DM Material Beam energy accuracy • Procedure works also for larger amounts of upstream matter • Linear within the beam energy accuracy
CTB simulation Sensitivity to DM Material Apply calibration constants derived for slightly different setup • Upstream material overestimated by 0.3 X0 - Upstream material underestimated by 0.3 X0 • Resulting error within 1% for E >50 GeV • 2% for E >50 GeV
a b h = 1 Longitudinal leakage Linearity: small leakage contribution, use of the average value only. Uniformity: correlation of leakage/energyin the back E3 If no leakage parameterization, becomes a dominant effect for uniformity (0.6% contribution)
Understanding of the uniformity D x D = 0.8 x 0.15 181 cells P13 0.34% rms P15 0.34 % P13/P15 0.24% Energy scale P13/P15 ~ 5 10-4 ! Normalized energy Uniformity over 300 cells < 0.5 % h From ATLAS physics TDR 0.5 % • Over < 0.8 region (181 cells) • Correlated non-uniformity P13/P15: 0.29 % • Uncorrelated non-uniformity : 0.17 % (P15) and 0.17 % (P13)
Data/MC Comparisons – Layer Fractions E=10 GeV E=50 GeV • Fraction of under electron peak can be estimated by looking at late showers: E1/(E2+ E3) • Pions depositing most of energy in Lar deposit large fraction electromagnetically, • but shower later than electrons • f MC-pion + (1-f) MC-electron gives good description of MC • Effect of pion contamination on reconstructed energy can be estimated from • simulated energy distributions -> effect is negliable • shift of energy distribution with/without E1/(E2+ E3) is negliable
Correlation of passive material with Eps Indeed 1 MIP ! This difference causes the linearity problem for