Download
1 / 1
10 likes | 209 Views
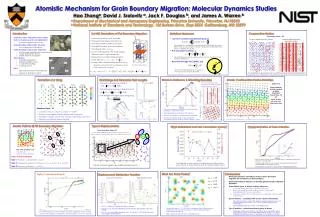
11. 22. 33. Free Surface. 22. 11. q. I. 33. Grain 2. III. IIa. IIb. IIc. Z. Grain Boundary. X. Grain 1. Y. R. Introduction. 3-d MD Simulations of Flat Boundary Migration. Cooperative Motion. Statistical Measures. Free Surface. Boundary Plane - XY.

E N D
11 22 33 Free Surface 22 11 q I 33 Grain 2 III IIa IIb IIc Z Grain Boundary X Grain 1 Y R Introduction 3-d MD Simulations of Flat Boundary Migration Cooperative Motion Statistical Measures Free Surface Boundary Plane - XY • Grain boundary migration is the central feature of grain growth, recrystallization • controls final grain size, texture, … • Understanding of boundary structure • low temperature observations • Understanding of boundary migration • macroscopic migration rate measurements • coarse-grained rate theory • limited atomistic simulations • Mechanisms • melting/crystallization • step/kink (SGBD) motion • cooperative shuffling • Coupling motion • Here • high T MD simulation of GB migration • analysis of all atomic motion • Molecular dynamics in NVT ensemble • EAM-type (Voter-Chen) potential for Ni • Periodic boundary conditions in x and y • One grain boundary & two free surfaces • Fixed biaxial strain, =xx=yy • Source of driving force is the elastic energy difference due to crystal anisotropy • Driving force is constant during simulation • Linear elasticity: • At large strains, deviations from linearity occur, determine driving force from the difference of the strain energy in the two grains: • van Hove correlation function (Self-part), Gs Atomic displacements: Dt=5ps Atomic displacements: Dt=0.4ps, t=30ps t(R) • By looking at Gs for different Dt, we can trace the path that the atoms takes as they move through the system. Distribution of distances atoms travel on different time scales. • Non-Gaussian Parameter, a2 Thisparameter provides a measure of how much Gs deviates from a Gaussian distribution. • Mean First-Passage Time (MFPT), t(R) S5 (001) tilt boundary This quantity characterizes how rapidly an atom escapes its local environment. • Substantial cooperative motions within boundary plane during migration Formation of a String Find Strings and Determine their Lengths Strings in Stationary & Migrating Boundary Atomic Configuration During Migration • The atom is treated as mobile if • Find string pair among mobile atoms using • The Weight-averaged mean string length: Dt = 4 ps at 800K plane X-Z 0 ps 1.8 ps 3.0 ps 3.6 ps 4.2 ps Atom positions during a period in which boundary moves by 1.5 nm Color time red=late time,blue=early time Stationary Boundary Dt = 4 ps at 1000K Migrating Boundary Boundary Plane - XY • Even in a stationary boundary, there is substantial string-like cooperative motion • String length shows maximum at T* (~80 ps) • Most of the strings form lines parallel to the tilt-axis • Boundary migration tends to decorrelate the cooperative motion, shorten T* from ~80 ps to ~26 ps • Colored by Voronoi volume; in crystal, V=11.67Å3 • Excess volume triggers string-like displacement sequence • Net effect – transfer volume from one end of the string to the other • Displacive not diffusive volume transport • Atomic displacements symmetry of the transformation Atomic Path for S5 Tilt Boundary Migration Type II Displacements What determines how fast a boundary moves? Trans-boundary plane X-Z Atom positions during boundary moves downward by 1.5 nm Color – Voronoi volume change – red= ↑over 10%, blue = ↓over 10% • Part of the simulation cell • CSL unit cell • Atomic “jump” direction ,- indicate which lattice Color – indicates plane A/B Types of Atomic Motions Type I:“Immobile” – coincident sites -I, dI= 0 Å Type II:In-plane jumps (either in A or B plane) – IIa, IIb, IIc, dIIa=dIIb=1.1 Å, dIIc=1.6 Å Type III:Inter-plane (A/B) jump - III , dIII=2.0 Å • The larger the excess volume, the faster the boundary moves • More volume easier Type II events faster boundary motion • Excess volume triggers Type II displacement events What Are those Peaks? Conclusions Rate Controlling Events Displacement Distribution Function • Molecular dynamics simulations of stress-driven boundary migration for asymmetric S5 tilt boundaries • Employed statistical measures to quantify grain boundary migration dynamics • Three distinct types of atomic motions observed: • very small displacement of coincident site atoms • single atom displacements with significant components perpendicular to the boundary plane • Collective motion of 2-10 atom groups in a string-like motion parallel to the tilt axis • Type II motions : correlated with excess volume of boundary • The atomic motions across the grain boundary plane occurs on a characteristic time scale t* of ~ 130 ps. Applied driving force decreases t*. • Type II displacements are rate controlling events • Type III motions: collective motion of group of atoms • String-like cooperative motion are intrinsic dynamics within grain boundary, it occurs on the characteristic time scale T* of ~26 ps. Applied driving force tends to decrease T* and biases its motion. Stationary Boundary dIIa = 1.13Ǻ dIIb = 0.71Ǻ dIIc = 1.24Ǻ dIII = 1.95 Ǻ Migrating Boundary • For Dt ~ 0.8ps Gs is approximately Gaussian • For Dt < t*, Gs for the migrating and stationary boundaries are very similar. • For Dt > t*, new peaks develop at r = 1.3 and r = 2.0 Ǻ and the peak at r0 begins to disappear • The broad peak at r = 1.3 Ǻ in the Gs represents Type II displacements (motions IIa and IIc), and the peak of r = 2.0 Ǻ represents Type III displacement (motion III). • Type II displacements are rate controlling events This suggests that both of these quantities provide different views of the same types of events during boundary migration. These events are not the string-like cooperative motions (26 ps = T* << t* = 130 ps). Atomistic Mechanism for Grain Boundary Migration: Molecular Dynamics Studies Hao Zhanga, David J. Srolovitz a, Jack F. Douglas b, and James A. Warren b a Department of Mechanical and Aerospace Engineering, Princeton University, Princeton, NJ 08540 bNational Institute of Standards and Technology, 100 Bureau Drive, Stop 8554, Gaithersburg, MD 20899 All of the atoms that are members of strings of length greater than 4 at Dt = T* Characterization of Type II Motion • At short time atomic motions are harmonic – transition away from harmonic at long times • Transition behavior occurs on much longer time scales than T* characteristic of string-like motion • The transition occurs at t*~130 ps for the migrating boundary