Download
1 / 37
370 likes | 546 Views
Example of the Greenhouse Effect. The Sun’s energy passes through the car’s windshield. This energy (heat) is trapped inside the car and cannot pass back through the windshield, causing the inside of the car to warm up. Nitrogen (N 2 ). Oxygen (O 2 ). Argon (Ar). Water (H 2 O).

E N D
Example of the Greenhouse Effect The Sun’s energy passes through the car’s windshield. This energy (heat) is trapped inside the car and cannot pass back through the windshield, causing the inside of the car to warm up.
Nitrogen (N2) Oxygen (O2) Argon (Ar) Water (H2O) Carbon Dioxide (CO2) Methane (CH4) Earth’s Atmospheric Gases Non-Greenhouse Gases >99% Greenhouse Gases <1%
Sun Venus Runaway Greenhouse Effect • 97% carbon dioxide • 3% nitrogen • Water & sulfuric acid clouds • Temperature:860°F
Carbon Dioxide (CO2) Greenhouse gases trap heat from the sun and keep our planet warm Burning fossil fuels (coal, oil, natural gas) increases CO2 levels. This traps more heat and causes the planet to get warmer. How Global Warming Works
Ice Core Data CO2 Measurements Before 1958 - Antarctica
CO2 Atmospheric Measurements CO2 Measurements Since 1958 – Mauna Loa, Hawaii
Global Warming Myths Just like with other things that involve responsibility and money...,any myths are created to deflect the blame
Global Warming Has Stopped? 1366.8 1366.6 1366.4 1366.2 1366.0 Solar Irradiance (W/m2) 1365.8 1365.6 1365.4 1365.2 NO IT HAS NOT! 0.8 0.6 0.4 D Mean Temperature (°C) 0.2 0.0 -0.2 1975 1980 1985 1990 1995 2000 2005 2010 Year
Global Warming is Caused by Sunspots? NO IT DOES NOT CORRELATE! 250 0.8 0.6 200 0.4 150 0.2 Sunspots D Mean Temperature (°C) 0.0 100 -0.2 50 -0.4 0 -0.6 1880 1900 1920 1940 1960 1980 2000 Year
Global Warming is Caused by GCR? 4600 4400 4200 4000 3800 Gamma Cosmic Rays 3600 3400 3200 3000 NO IT DOES NOT CORRELATE EITHER! 1.0 0.8 0.6 0.4 D Mean Temperature (°C) 0.2 0.0 -0.2 -0.4 1950 1960 1970 1980 1990 2000 2010 Year
Land vs. Ocean Land Ocean 1920 1960 2000 Year Global Warming Primarily Impacts the Northern Hemisphere? FALSE! Global Warming Primarily Impacts the Land FALSE! Northern vs. Southern Latitude 1.0 Northern Hemisphere Southern Hemisphere 0.8 0.6 0.4 0.2 Temperature Change (°C) 0.0 -0.2 -0.4 -0.6 1920 1960 2000 Year
Global Warming is Due to Heat from the Cities? -4.1 -4 -2 -1 -.5 -.2 .2 .5 1 2 4 4.1 NOT TRUE! 2009 Temperature Changes Compared to 1951-1980
Carbon Dioxide Levels Muana Loa Readings CO2 Levels Since 1958 370 350 CO2 (ppm) 330 310 40 30 20 10 0 420 370 320 CO2 (ppm) 270 220 Dome Concordia Vostok Ice Core 170 600000 400000 200000 0 Time (YBP)
Volcanoes Put Out More CO2 Than Fossil Fuel Burning? Fossil Fuel Volcanoes NO THEY DO NOT! 10 8 6 Carbon (109 metric tons) 4 2 0
National Carbon EmissionsMetric Tons per Year • 2007 • China 6,538,367,000 • United States 5,838,381,000 • India 1,612,362,000 • 2009 • United States 5,762,050,000 • China 3,473,600,000 • Russia 1,540,360,000
Pounds of Carbon Dioxide • ___ tons CO2 X 2205 lbs/ton = ___lbs CO2 • ___ tons CO2 X 556200 L/ton = ___L CO2 • ___ tons CO2 X 770 lbs/ton = ___lbs Coal 500 lbs. of coal
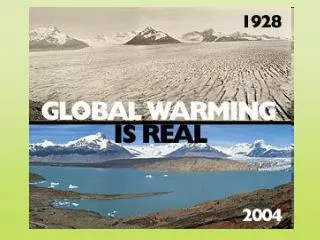
2004 1914 Portage Glacier • Alaska
CO2 Vs. Sea Level 40 320 6 20 4 300 0 2 280 -20 0 260 CO2(ppmv) -40 -2 Relative Sea Level Temperature 240 -60 -4 220 -80 -6 200 -100 -8 -120 -10 180 CO2 Vs. Temperature 500000 400000 300000 200000 100000 0 Time (ybp) Rohling et al. 2009. Antarctic temperature and global sea level closely coupled over the last five glacial cycles. Nature Geoscience 2:500.
Billions of Metric TonsCarbon Goal: Reductions in CO2 Per Year 2007
Our Goal Billions of Metric TonsCarbon Produce electricity efficiently Use electricity efficiently Vehicle efficiency Solar and Wind Power Biofuels Carbon capture and storage Gigaton Carbon Reductions in CO2 Per Year 2007
What’s being done now to reduce our emissions? Wind Power Solar Power Fuel-Efficiency
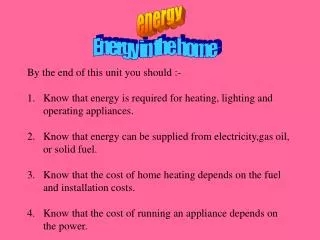
Simple Things To Do Turn off your computer or the TV when you’re not using it. Take shorter showers. Heating water uses energy. Keep rooms cool by closing the blinds, shades, or curtains. Turn off the lights when you leave a room. Use compact fluorescent bulbs.
500 lbs. of coal Be Bulb Smart—Use CFLs What’s the difference? Compact Fluorescent Incandescent • 1,430 lbs. CO2 pollution avoided • $30 saved
Simple Things To Do Dress lightly when it’s hot instead of turning up the air conditioning. Or use a fan. Dress warmly when it’s cold instead of turning up the heat. Offer to help your parents keep the air filters on your AC and furnace clean. Walk short distances instead of asking for a ride in the car. Plant a tree. Recycle.