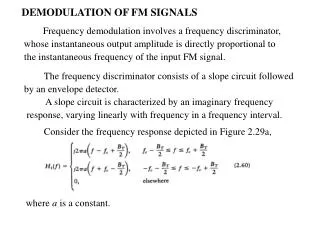
Download

1 / 10
100 likes | 268 Views
Relationship between radiation dose and chromosome aberration frequency – Calibration curves. Piotr Knapp Piotr Wróblewski. Supervisors: Ekaterina Zaytseva, Polina Kutsalo, Marta Deperas-Kamińska. Laboratory of Radiation Biology. The fate of irradiated cell. Gy. After high dose.

E N D
Relationshipbetweenradiationdose and chromosomeaberrationfrequency – Calibrationcurves Piotr Knapp Piotr Wróblewski Supervisors: Ekaterina Zaytseva, Polina Kutsalo, Marta Deperas-Kamińska Laboratory of Radiation Biology
The fate of irradiated cell Gy After high dose Necrotic death Healthy cell Somatic effect No effect Micronuclei No effect Mitotic death Cancer Correct repair Incorrectrepair Cell with damaged DNA Stable chromosomal Aberrations - Mutations Unstable chromosomal aberrations Apoptotic death Mutation path Somatic effect In the germ cells Somatic effect Carcinogenic effect Genetic effect
Aim of theproject • Creation of dose dependency calibration curve of chromosomal aberrations in human peripherial blood lymphocytes exposed to protons beam (LET≤100keV/µm) performed at Phasotrone (LNP, JINR) • Biological dosimetry - Allow to assess an accidental radiation dose on base of the level of changes in chromosome structure.
Scheme of theexperiment Culture of irradiated blood BrdU Colcemid Fixation 0-24h 48h 48-50h StainingwithFluorescence Plus Giemsa Watching
An example of cellstainedwithGiemsadyewithdicentricchromosome.
OurCalibrationCurve Aberration per cell DOSE [Gy]
Specialthanks to: • Marta Deperas-Kamińska • Polina Kutsalo • Ekaterina Zaytseva


![G3 - RADIO WAVE PROPAGATION [3 Exam Questions -- 3 Groups]](https://cdn0.slideserve.com/819386/g3-radio-wave-propagation-3-exam-questions-3-groups-dt.jpg)