Download
1 / 39
390 likes | 550 Views
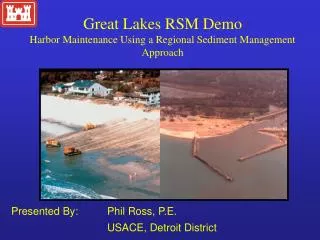
Great Lakes RSM Demo Harbor Maintenance Using a Regional Sediment Management Approach. Presented By: Phil Ross, P.E. USACE, Detroit District. Presentation Outline. Brief Intro to RSM Demo on the Great Lakes. Dredge Material Management Plans (DMMP).

E N D
Great Lakes RSM DemoHarbor Maintenance Using a Regional Sediment ManagementApproach Presented By: Phil Ross, P.E. USACE, Detroit District
Presentation Outline • Brief Intro to RSM Demo on the Great Lakes. • Dredge Material Management Plans (DMMP). • Case Study: Michigan City, IN (RSM + DMMP). • Regulatory Policy Development Addressing Structure Impacts on Sediment Resources. • Summary.
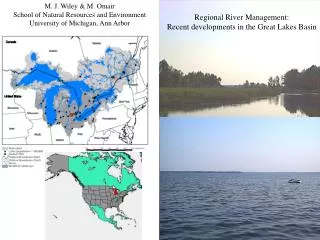
Great Lakes RSM Program • Initial Region of Focus • Ludington, Michigan to Burns Harbor, Indiana. • 172 Miles of Shoreline. • Contains 12 Federal Harbors. • Coastal Issues (Bluff Erosion, Mitigation, Dredging).
South Haven St. Joseph Grand Haven Great Lakes RSM ProgramImportant Characteristics of Region • Southeast Lake Michigan • Monitoring of 7 Federal Harbors for Mitigation Purposes. • Section 111 of Rivers and Harbors Act of 1968. • Study Effects of Federal Navigation Structures. • Placement of Dredged Sediment in Nearshore. • Many Erosion Issues Holland
Case Study: Michigan City, IN Characteristics: • Located 10 Miles South of Michigan – Indiana Border • Various Stakeholders Involved. • On-Going Development of a Dredge Material Management Plan (DMMP).
DMMP Definition • Dredged Material Management Plan. • Governing Authority is Section 404 of the Clean Water Act of 1972. • Goal is to Develop Least Costly plan spanning 20-years that is consistent with: • Sound Engineering Practice. • Meets All Federal Environmental Standards. • Three Step Process.
Three Step Process of DMMP • Preliminary Assessment. • Initial Report. • Determine whether Continuing Operations and Maintenance is Warranted. • Determine if DMMP Study is Needed. • Management Plan Study. • Develop Scope of Work. • Determine Existence of Economic, Engineering, and Environmental Risks. • Investigate Beneficial Uses. • Develop “Base Plan” (Based on Cost primarily). • Costs falling outside of “Base Plan” that address Local or State Needs and/or Standards are Not Covered under Federal Funding. • Implementation.
Initial DMMP at Michigan City • Harbor Divided into 3 – Areas: • Outer Harbor: Clean / Beach Suitable Sediment. • Lower Trail Creek: Unclean Sediment. • Upper Trail Creek: Clean / Unsuitable Beach Sediment. • 3 – Initial Plans Developed. • Outer Harbor: Continue Dredging as is / Place in Nearshore. • Lower Trail Creek: CDF 30 miles away . • Upper Trail Creek: Sediment Trap.
Regional Stakeholders Dale Engquist, National Park Service Bob Daum, National Park Service Stephen Davis, Indiana Department of Natural Resources Steve West, Indiana Department of Environmental Management Tim Frame, Michigan City Port Authority Sam Johns, Michigan City Board of Trustees Matt Warner, Michigan Department of Environmental Quality Drew Benziger, USACE, Chicago Rich Saichek USACE, Chicago Kallan Mrozek, USACE, Chicago Don Wadleigh, USACE, Chicago Susanne Davis, USACE, Chicago Monica Ott, USACE, Chicago Phil Ross, USACE, Detroit
Implementation of RSM Philosophy into DMMP Development Philosophy: • Expand Focus of DMMP from Project-Based Decisions to Regional-Based Decisions. • Include All Stakeholders in Decision making Process. • Address Sediment Management Effects rather than Dredging and Disposal Issues.
RSM Philosophy At Michigan City • Outer Harbor – Benefits. • Clean / Beach Suitable Sediment. • Define Sediment Management Plans. • Implement RSM. • Trail Creek - Reduction. • Both Contaminated and Non-Contaminated Sediment. • Requires Upland Disposal. • Define Sediment Management Plans to Limit Future Dredging of Contaminated Sediment. • Utilize Section 516(e) – Great Lakes Tributary Modeling to Control Sediments from Upstream.
Section 516(e) – Great Lakes Tributary Modeling • WRDA 1996 • Develop sediment transport models for tributaries to the Great Lakes that discharge into Federal Navigation Channels. • Model may Contain Hydrologic, Hydraulic, Sediment Delivery, and Sediment Transport components. • Model will be given to local Sponsor for Watershed Management.
Four Regional Issues DefinedFrom Workshops • Maintenance of East Accretion Fillet. • Removal of West Accretion Fillet. • Nourishment Program West of Michigan City. • Adverse Effects to Beaches East of Michigan City.
Regional Issue 1:Maintenance of East Accretion Fillet • From 1967 – 1998, East Accretion Fillet as Grown 30m. • Beach susceptible to aeolian transport. • Port Authority cannot keep up with Shoaling. • Excavation efforts of Beach costly and ineffective.
Regional Issue 2:Removal of West Accretion Fillet • Safety Issue between Surfers and Boaters. • Increases Shoaling Rate in Harbor.
Regional Issue 3:Nourishment Program West of Michigan City • In 1974, Beach Nourishment Project Authorized at Mount Baldy. • Only 1 Million CY Placed of Estimated 6.8 Million CY needed. • Nourishment program more costly due to trucking through wetland. • Trucking can cause damage to surrounding wetlands.
Regional Issue 4:Adverse Effects to Beaches East of Michigan City • Bypassing of east accretion fillet material may cause adverse effects updrift. • Need to know the effects of our actions before implementation.
Alternatives to Address Issues • Alt 1: Continue Dredge Program as is. • Alt 2: Excavate West Accretion Fillet. • Alt 3: Provide Bypassing Pipe Line for Excavation of East Accretion Fillet. • Alt 4: Expand Dredging to Cover Area Behind Detached Breakwater • Alt 5: Excavate West Accretion Fillet and Dredge Behind Detached Breakwater. • Alt 6: Provide Bypassing Pipe Line for Excavation of East Accretion Fillet and Expand Dredging to Cover Area Behind Detached Breakwater. • Alt 7: Provide Bypassing Pipe Line for Excavation of East Accretion Fillet and Expand Dredging to Cover Area Behind Detached Breakwater and Dredge Behind Detached Breakwater.
RSM Case Study Goals • By Addressing Sediment Management Rather than Dredging Issues, Substantial Cost Savings can be Obtained over a 20-Year Design Life. • Development of Analysis Tools and Base Data Sets for Region Would Reduce Initial Costs in DMMP process. • Involve Stakeholders early in the process to Increase Environmental, Economical, and Engineering Benefits over a 20-Year Design Life. • Establish Precedent on the Great Lakes of Sediment Management Techniques at Federal Harbors.
Mitigation PolicyHistory of Erosion Issues on The Great Lakes 1970’s: Section 111 Authority created to monitor federal structures. 1980’s: High Water, More Structures built, Detroit District begins placing most dredge material within nearshore. 1990’s: Recognize that private structures can affect the nearshore sediment supply by.
Final Report – Fiscal Year 2001/02 FEPS Modeling for LMPDS Cohesive Shorelines Sandy Shorelines
LST In Offshore Loss 98,000 67,320 13,000 Accretion fillets Bluff Erosion 52,320 35,000 Nourishment LST Out 105,000 Sediment Budget Without Shore Protection All Values are in Yards3 / Year
LST In Offshore Loss 98,000 67,320 13,000 Accretion fillets Bluff Erosion 29,840 35,000 Nourishment LST Out 82,520 Sediment Budget With Shore Protection All Values are in Yards3 / Year Shore Protection
History of Erosion Issues on The Great Lakes • 1990’s (continued): • Mitigation Policy Introduced & Rejected • Reasons • Singled out Properties • Inconsistently Enforced • On-going Nourishment a Nuisance. • Public opinion: Corps Does Not Nourish
New Proposed Mitigation Policy • Encompass All Shoreline Types/ • Include Maintenance and Installation Permits. • Technology and Data Available for Scientifically Defendable Analysis: • FEPS: Flood and Erosion Prediction System. • Requires More Development • Mitigation Requirements are Based on Individual Properties: • Recession Rates. • Bluff Heights • Shore Length • Material Make-Up of Bluff • Design Life of Structures • Permit Requirement to include One Time Fee for Nourishment based on Design Life of Structure. • Fee Used to Supplement Nourishment Supplies on Planned USACE Dredge / Nourishment Programs in Region.
RSM Ideology in Mitigation Policy • Address All Projects within a Regional Context. • Implement Regional Database for Efficient Analyses. • Promote Stakeholder Involvement on Coastal Issues.
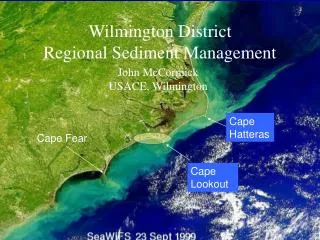
Numerical Modeling to Investigate Alternatives and Benefits • Saugatuck Harbor Impact Assessment. • In 1992, Preliminary Study concluded that a more detailed study would be needed. • USACE authorized under Section 111 to investigate potential negative impacts of Federal Structures. • Innovative Analysis Technique Utilized. • Old studies relied on comparisons of updrift and downdrift recession to determine effects. • This study addressed influences on littoral currents by the Federal Structures. Dibajnia, M., Baird & Associates, “Saugatuck Harbor Impact Assessment” (2002) Dibajnia, Nairn, and Ross
Long-Term Sand AccumulationAnalysis • Based on Implementation of a 2DH hydrodynamic and Sediment Transport Model (HYDROSED). • Spectral Wave Transformation Model • To Calculate Wave Field • Hydrodynamic Model • To Describe Wave Generated Nearshore Currents and Circulations • Sediment Transport Model • Based on sheet flow transport formula (Dibajania (1995)) Dibajnia, Nairn, and Ross
Long-Term Sand AccumulationAnalysis • Problems with use of Numerical Modeling Method: • HYDROSED is Computationally Time Consuming. • Interest in Overall Bypassing Rate with respect to Average Longshore Transport Rate. • Modeling cannot be applied to Time Series of Wave Conditions spanning many years. • Solution: Develop Hydraulic Parameters Using HYDROSED for long-term analysis. Dibajnia, Nairn, and Ross
Long-Term Sand AccumulationAnalysis 471 Cases Calculated 900 hours of Model Simulations. Dibajnia, Nairn, and Ross
-70 Existing bathymetry H = 2 m 1/3 Straight shoreline T = 9 s Nonzero riverflow 1/3 -60 waves /hr) -50 3 LST (m -40 -30 -20 Jetties 0 400 800 1200 1600 2000 2400 Distance alongshore (m) Local Bypassing Ratio First 500m Dibajnia, Nairn, and Ross
-70 Existing bathymetry H = 2 m 1/3 Straight shoreline T = 9 s Nonzero riverflow 1/3 -60 waves /hr) -50 3 LST (m -40 -30 -20 Jetties 0 400 800 1200 1600 2000 2400 Distance alongshore (m) Downdrift Erosion Ratio First 500m Dibajnia, Nairn, and Ross
SWL = 1.4 m 100 SWL = 0.0 m Straight Beach 0 / hr, positive northward) -100 3 LST (m 2 1.5 0.6 x = H T Sin 2a 0 0.4 LST = 40(abs( x )) sinh( x /400) ( x > 0 ) -200 0.25 LST = 300(abs( x )) sinh( x /1800) ( x < 0 ) -300 -200 -100 0 100 200 2 1.5 0.6 2 s Long-Term Sand AccumulationAnalysis Relation between calculated longshore sand transport rates and the selected parameter: 1.5 H T Sin 2a (m ) 0 Dibajnia, Nairn, and Ross
Effect of water level and bathymetry on transient local bypassing ratio: 1.2 0.8 Transient local bypassing ratio 0.4 3 Q = 120 m /s 0 wl = 0.0 m wl = 1.4 m straight shoreline -0.4 -300 -200 -100 0 100 200 2 1.5 0.6 2 1.5 H T Sin 2a (m s ) Long-Term Sand AccumulationAnalysis 0 Dibajnia, Nairn, and Ross
1 0.8 0.6 Downdrift erosion ratio 0.4 2 1.5 0.6 x = H T sin 2a 0 0.2 0.65 / 10 ) y = 0.98 tanh ( | x | / 90 ) + (1-tanh ( | x | / 68 )) · tanh ( | x | 0 -300 -200 -100 0 100 200 2 1.5 0.6 2 1.5 H T sin 2a (m s ) 0 Long-Term Sand AccumulationAnalysis Dibajnia, Nairn, and Ross
Long-Term Sand AccumulationAnalysis • COSMOS Model utilized to calculate LST rates. • Deterministic detailed coastal processes model using: • Bathymetry • Sediment Grain Size • Wave Data • Assumed Sufficient Sand Cover (Potential LST). Dibajnia, Nairn, and Ross
Long-Term Transport AnalysisAt a Harbor • Other Data Sources: • 50-Year Wave Hindcast Data. • History of Fillet Beach Growth (Aerial Photography). • Dredging Data. • Grains Size Data. • River Flow Data. • Water Level Data. Dibajnia, Nairn, and Ross
Long-Term Sand AccumulationAnalysis Dibajnia, Nairn, and Ross