Download
1 / 56
560 likes | 839 Views
Agriculture Can We Feed The World? Grant R. Cramer Plant Biology 330 Fall 2001 Humanity has grown in numbers over time 7,000 6,000 5,000 4,000 Millions of people 3,000 2,000 1,000 0 0 500 1000 1500 2000 2500 Year Global Population Continues to Rise

E N D
AgricultureCan We Feed The World? Grant R. Cramer Plant Biology 330 Fall 2001
Humanity has grown in numbers over time 7,000 6,000 5,000 4,000 Millions of people 3,000 2,000 1,000 0 0 500 1000 1500 2000 2500 Year
Decrease in population growth rate • NOT associated with wealth, gross national product or economic development • IS associated with increased education, especially the education of mothers
1960 1965 1970 1975 1980 1985 1990 1995 2000 Yields Are Up, But Growth is Slowing 5 4 3 Yield (metric tons/hectare) 2 1 0 Wheat Yield Maize Yield Rice Yield
1960 1965 1970 1975 1980 1985 1990 1995 2000 Maize Yields Are Up, But Growth is Slowing 12 10 8 % Increase in Yield 6 4 2 0 -2 Wheat Paddy Rice
Intensive Agricultural has Benefited Mankind • 24% more food per person today than in 1961 despite an increase of 89% more people • 40% lower food prices than in 1961 (in real terms)
Demand for Food Growing Faster than Population • Increase in affluence leads to greater meat consumption • Meat production growing 50% faster than crop production • Meat production much more energy intensive • 7 kg of grain per kg of pork; 5 kg of grain per 1 kg of beef; 2 to 3 kg of grain per kg of eggs, cheese or poultry
Final Analysis • Economic and agricultural development do not necessarily abolish hunger • Equitable distribution is also important and is governed by social, economic and political influences
Weather and Climate Profoundly Affect Crop Production • Affects sunlight, moisture, temperature and natural disasters • By far, the lack of water is the most significant constraint to agricultural production in all agricultural zones: tropical, sub-tropical and temperate • Temperature also constrains crop production in the temperate zones
Humans Can Affect the Climate and Influence Agricultural Production • Desertification in the Sahel • Greenhouse Effect
Global warming enhanced by emissions of man-made gases Source: “Climate Change, State of Knowledge,” OSTP, 1997
Much is known with certainty about global warming: • Existence of natural greenhouse effect is established beyond doubt • Concentrations of greenhouse gases (GHGs) are increasing • The temperature of the earth is increasing. 1998 the hottest in at least 1000 years. • Sea levels are rising (4 to 10 inches over past 100 years) • Some GHGs will remain in the atmosphere for centuries
CO2 is building up in the atmosphere Source: “Climate Change, State of Knowledge,” OSTP, 1997
Atmospheric methane (CH4) concentrations Data Source: D.M. Etheridge et al. Concentrations of CH4 from the Law Dome (East Side, "DE08" Site) Ice Core(a), Commonwealth Scientific and Industrial Research Organisation, Aspendale, Victoria, Australia. September 1994. Available: http://cdiac.esd.ornl.gov/ftp/trends/methane/lawdome.259. M.A.K. Khalil, R.A. Rasmussen, and F. Moraes. "Atmospheric methane at Cape Meares: Analysis of a high resolution data base and its environmental implications." Journal of Geophysical Research 98:14,753-14,770. 1993. Available: http://cdiac.esd.ornl.gov/ftp/db1007/cmeares.mon
Earth’s temperature continues to rise rapidly Source: “Climate Change, State of Knowledge,” OSTP, 1997
Earth is projected to grow warmer Source: Univ. of East Anglia, IPCC
Uncertainties still persist • Timing and regional impacts • The effects of increased cloudiness • Uncertain health and ecological impacts • Possible surprises from unanticipated effects
More impacts of global warmingcan be expected • More health effects from the spread of tropical diseases, heat waves, and so-called “natural disasters” • Loss of agricultural land in developing countries • Disappearance of ecosystems that are unable to migrate
Cumulative carbon emissions, 1950-1996 Data Source: Marland et al, 1999. Carbon Dioxide Information Analysis Center.
Per capita emissions of carbon from industrial sources, 1996 Data Source: Marland et al, 1999. Carbon Dioxide Information Analysis Center.
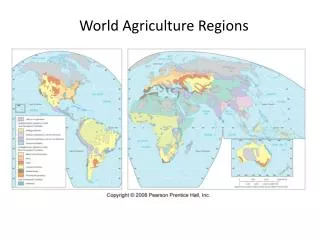
How Much Arable Land is There • Only 12% of the world soils are arable • 26% is for pastures • 31% for forests
World Agricultural Land Distribution • Latin America, Sub-Saharan Africa and the former Soviet Union have the most agricultural land • Europe (71%), South Asia (73%) and Southeast Asia (47%) have highest percentage of total land as agricultural land • 70% of South Asia and Southeast Asia agricultural land is the most intensive
Increased resource use for increased crop production • Introduction of new crops • Mechanization • New and improved varieties • Inorganic fertilizers • Irrigation • Pesticides
Irrigated Soils Today • 15% of the arable soils • Twice as productive as rain-fed soils • Produce a third of the world’s food • Subject to salinization in semi-arid environments
Are These Practices Sustainable? What are the impacts of • Land Degradation • Energy • Pesticides • Genetically Uniform Crops
Land Degradation • 15% of total world soils (1964 Mha of 13,077 Mha) lost to soil degradation in the last 45 years • 38% of cropland; 21% of pasture; 18% of forests resulting in 13% loss in productivity for croplands • Most of this lost is due to wind and water erosion (1725 Mha) • Nutrient loss (135 Mha) • Salinity (77 Mha)
Human-Induced Degradation • 35% attributed to overgrazing • 28% attributed to agricultural-related management • 29% attributed to deforestation
Degraded Soil Means Less Food World Totals (million hectares) Vegetation Removal 579 Overexploitation 133 Overgrazing 679 Agricultural Activities 522 Industrial and Bioindustrial 23