Topic 12: Multiple Linear Regression
Topic 12: Multiple Linear Regression. Outline. Multiple Regression Data and notation Model Inference Recall notes from Topic 3 for simple linear regression. Data for Multiple Regression. Y i is the response variable

Topic 12: Multiple Linear Regression
E N D
Presentation Transcript
Outline • Multiple Regression • Data and notation • Model • Inference • Recall notes from Topic 3 for simple linear regression
Data for Multiple Regression • Yi is the response variable • Xi1, Xi2, … , Xi,p-1 are p-1 explanatory (or predictor) variables • Cases denoted by i = 1 to n
Multiple Regression Model • Yi is the value of the response variable for the ith case • β0 is the intercept • β1, β2, … , βp-1 are the regression coefficients for the explanatory variables
Multiple Regression Model • Xi,k is the value of the kthexplanatory variable for the ith case • ei are independent Normally distributed random errors with mean 0 and variance σ2
Multiple Regression Parameters • β0 isthe intercept • β1, β2, … , βp-1 are the regression coefficients for the explanatory variables • σ2 the variance of the error term
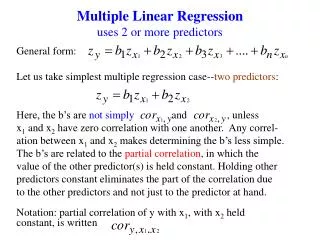
Interesting special cases • Yi = β0 + β1Xi + β2Xi2+…+ βp-1Xip-1+ ei (polynomial of order p-1) • X’s can be indicator or dummyvariables taking the values 0 and 1 (or any other two distinct numbers) • Interactions between explanatory variables (represented as the product of explanatory variables)
Interesting special cases • Consider the model Yi= β0 + β1Xi1+ β2Xi2+β3X i1Xi2+ ei • If X2 a dummy variable • Yi = β0 + β1Xi + ei (when X2=0) • Yi = β0 + β1Xi1+β2+β3Xi1+ ei (when X2=1) = (β0+β2)+ (β1+β3)Xi1+ ei • Modeling two different regression lines at same time
Least Squares Solution Fitted (predicted) values
Covariance Matrix of residuals • Cov(e)=σ2(I-H)(I-H)΄= σ2(I-H) • Var(ei)= σ2(1-hii) • hii= X΄i(X΄X)-1Xi • X΄i =(1,Xi1,…,Xi,p-1) • Residuals are usually correlated • Cov(ei,ej)= -σ2hij
Distribution of b • b = (X΄X)-1X΄Y • Since Y~N(Xβ, σ2I) • E(b)=((X΄X)-1X΄)Xβ=β • Cov(b)=σ2 ((X΄X)-1X΄)((X΄X)-1X΄)΄ =σ2(X΄X)-1 • σ2 (X΄X)-1 is estimated by s2 (X΄X)-1
ANOVA Table • Sources of variation are • Model (SAS) or Regression (KNNL) • Error (SAS, KNNL) or Residual • Total • SS and df add as before • SSM + SSE =SSTO • dfM + dfE = dfTotal
ANOVA Table Source SS df MS F Model SSM dfM MSM MSM/MSE Error SSE dfE MSE Total SSTO dfTotal MST
ANOVA F test • H0: β1 = β2 = … = βp-1 = 0 • Ha: βk≠ 0, for at least one k=1,., p-1 • Under H0, F ~ F(p-1,n-p) • Reject H0 if F is large, use P-value
P-value of F test • The P-value for the F significance test tells us one of the following: • there is no evidence to conclude that any of our explanatory variables can help us to model the response variable using this kind of model (P ≥ .05) • one or more of the explanatory variables in our model is potentially useful for predicting the response variable in a linear model (P ≤ .05)
R2 • The squared multiple regression correlation (R2) gives the proportion of variation in the response variable explained by all the explanatory variables • It is usually expressed as a percent • It is sometimes called the coefficient of multiple determination (KNNL p 226)
R2 • R2 = SSM/SST • the proportion of variation explained • R2 = 1 – (SSE/SST) • 1 – the proportion not explained • Can express F test is terms of R2 F = [ (R2)/(p-1) ] / [ (1- R2)/(n-p) ]
Background Reading • We went over KNNL 6.1 - 6.5