Linear Models in Algebra: Lesson 2-4
Explore exercises and samples of linear models in Algebra, including intercepts, trends, fitting data, and cost analysis concepts.

Linear Models in Algebra: Lesson 2-4
E N D
Presentation Transcript
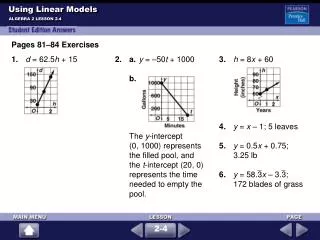
Using Linear Models ALGEBRA 2 LESSON 2-4 Pages 81–84 Exercises 1.d = 62.5h + 15 2. a.y = –50t + 1000 b. The y-intercept (0, 1000) represents the filled pool, and the t-intercept (20, 0) represents the time needed to empty the pool. 3.h = 8x + 60 4.y = x – 1; 5 leaves 5.y = 0.5x + 0.75; 3.25 lb 6.y = 58.3x – 3.3; 172 blades of grass 2-4
Using Linear Models ALGEBRA 2 LESSON 2-4 7.y = 1.75x + 1.75; $8.40 8. Linear model is reasonable; models may vary. Sample: y = –1.3x + 11 9. Linear model is reasonable; models may vary. Sample: y = 2.6x – 0.6 10. Linear model is reasonable; models may vary. Sample: y = –0.75x – 3.7 11. not reasonable 2-4
Using Linear Models ALGEBRA 2 LESSON 2-4 12. a. Linear model is reasonable. b. 40 c. Answers may vary. Sample: After drawing a trend line on the graph, locate the European size on the y-axis. Then find the corresponding U.S. size on the x-axis. 13. a. Answers may vary. Sample: y = 125x + 975 b. 2975 cal c. Answers may vary. Sample: No; adults need fewer Calories, not more. 2-4
Using Linear Models ALGEBRA 2 LESSON 2-4 14. a. b–e. Answers may vary. Samples are given. b.c = 0.04A c. The model fits the data very closely. d. No; the area of the tarp is 150 ft2 so the price should be $6.00. e. 6 8 ft; $0.07 15.y = –4x + 10 16.y = –3x – 6 17.y = –7.5x – 2.5 18.y = 1.4375x – 7.33125 2-4
Using Linear Models ALGEBRA 2 LESSON 2-4 19. a.y = 29.95 b.y = 2.95x; slope = 2.95, y-intercept = 0 c. Answers may vary. Sample: Either way, you will average the same costs over the long run. 20. a. Answers may vary. Sample: y = 0.0714x – 9.3 b. 14.3 g c. 200 Cal; a 200 Cal hamburger is closer to 5 g. 2-4
Using Linear Models ALGEBRA 2 LESSON 2-4 21. a. population b–c. d. 2 million e. Answers may vary. Sample: Strong; the points fall close to a straight line. 22. 104.5 23. 85.8 24. 6.5 25. 13 26. 882 2-4
Using Linear Models ALGEBRA 2 LESSON 2-4 17 11 27. a. b. about $3900 c. about $1400 d. Answers may vary. Sample: No, expenditure would be predicted to be about $5000. 28. a.y = – x + 14.27 b.y = –2x + 10 c. Answers may vary. Sample: neither; y = –1.5x + 12 29.y = x – 2 30. 13.37 31. 1.10 32. 6.10 33. 8.09 5 2 2-4
40. {–7, –3, –1, 2, 7} 41. {1, 3.5, 5, 6, 8} 42. {3, 4, 5.25, 12, 19} 43.{} 44. {–299, –99, 1, 151, 401} 45. {1, 6, 9, 11, 15} 46. a. 20.91 ft/s; 2091 ft b.d = 20.91t c. 14.25 mi/h 7 2 5 2 5 4 – , – , –2, – , 0 Using Linear Models ALGEBRA 2 LESSON 2-4 16 3 34. a.y = – x + 72.6 b. 35.3 tons 35. a. Answers may vary. Sample: y = x + b. 70 36. –2.7; 13.5 37. –3; 15 38. – ; 6 39. ; –42 16 3 2 3 6 5 42 5 2-4