2.4 Using Linear Models
2.4 Using Linear Models. The Trick: Converting Word Problems into Equations. Warm Up: How many ways can a $50 bill be changed into $5 and $20 bills. Work with a partner and come up with as many combinations as possible. . $5 and $20 Combinations:.

2.4 Using Linear Models
E N D
Presentation Transcript
The Trick: Converting Word Problems into Equations • Warm Up: • How many ways can a $50 bill be changed into $5 and $20 bills. Work with a partner and come up with as many combinations as possible.
How can we write this as an Algebraic Equation? • 1st: Define your variables • Let’s let x = the number of $5 bills and y = the number of $20 bills • 2nd: Set up an equation where the sum of the bills equals 50
We now have the equation 5x + 20y = 50 Next: Graph this equation. What do you notice?
What does it all mean? Describe in your own words, what is going on in this graph? Come up with as many different “revelations” as possible
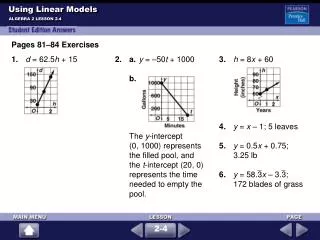
More Examples • Suppose an airplane descends at a rate of 300 feet per minute from an elevation of 8000 feet. Write an equation to model the plane’s elevation as a function of the time it has been descending. Interpret the intercepts at which the graph intersects the vertical axis. Let d = distance and t = time. • Equation: d = -300t + 8000
Equation: d = -300t + 8000 • Now, graph the equation. Why are the intercepts of the graph important? 8000 20 30
Making the best of data • Sometimes the points are not as nice as you like A Trend Line is a line that approximates the relationship between the data points of a scatter plot. You can use it to make predictions by best fitting a line through the data.
Correlationspositive Outlier As x increases Then y increases POSITIVE SLOPE “Trend line” or “regression line”
Correlationsnegative As x increases Then y decreases Negative SLOPE
Correlationsnone No real trend line
For The Next Class: • Print a copy of How to Best Fit a Line (Linear Regression) from the class web site. • Bring a Graphing Calculator to class! It’s Show Time!