Download
1 / 17
180 likes | 415 Views
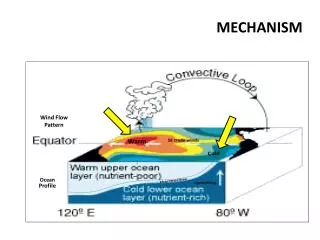
Market based mechanism. Perform, Achieve and Trade A.K.ASTHANA Sr. Technical Expert, GIZ, India. World CO 2 Emission Savings. 45. Share of cumulative abatement between 2010-2035. Gt. Current Policies Scenario. 42.6 Gt. 7.1 Gt. 40. Efficiency. 50%. New Policies Scenario .

E N D
Market based mechanism Perform, Achieve and Trade A.K.ASTHANA Sr. Technical Expert, GIZ, India
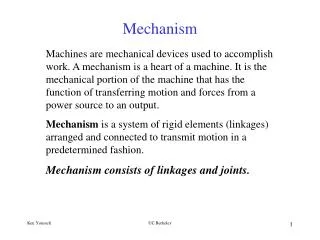
World CO2 Emission Savings 45 Share of cumulative abatement between 2010-2035 Gt Current Policies Scenario 42.6 Gt 7.1 Gt 40 Efficiency 50% New Policies Scenario Renewables 18% 35.4 Gt 35 Biofuels 4% Nuclear 9% 13.7 Gt 30 CCS 20% Source: WEO 2010 25 450 Scenario 21.7 Gt 20 • New Policies Scenario is the central scenario in WEO-2010 • assumes cautious implementation of recently announced commitments & plans, even if yet to be formally adopted • The 450 Scenario sets out an energy pathway consistent with the goal of limiting increase in average temperature to 2OC 2008 2015 2020 2025 2030 2035
India – CO2 Emission Reduction Share of cumulative abatement between 2010-2035 Efficiency 51% Renewables 32% Biofuels 1% Nuclear 8% CCS 8%
Energy Profile - India GHG Emissions Across Sectors Energy Intensity - Industrial Sector
The market based mechanism to enhance the cost effectiveness in improving the Energy Efficiency in Energy Intensive industries through certification of energy saving which can be traded Perform, Achieve & Trade (PAT) Mechanism • Penalize under performer • Reward over achiever • Market Based Mechanism Stakeholders Processes Involved
Concept of Target, Compliance, Escerts & Penalty Issued Escerts Penalty Baseline SEC Target Achieved SEC Compliance Target SEC Purchase Escerts Scenario 1 Scenario 2
PAT Activity Flow Sheet Issuance of e-Certs after successful M&V Baseline & Target Setting (based on last three years) (Annual submission but the target compliance for three years) Market for Trade
Challenges • Technical • Scale of Production (Installed Capacities) • Use of Raw Material • Process Technology • Vintage • O & M Practices • Type of Product Output • Variation in output/product • Plant boundary • Variation in fuel quality • Plant load factor • Monitoring & Verification
PAT Scheme : Background & Scope • Covers 478 designated consumers in 8 sectors • All DCs consume about 165 mtoe energy • Targets would be given to all DCs to achieve the same within a time frame • Achievement > Target E-Scerts • Achievement < Target Purchase E-Scerts / Penalty • National Target = 6.6 mtoe at the end of 1st PAT Cycle ( by 2014-15)
PAT Scheme : Approach Towards Target Setting • Sectoral Target will be on pro-rata basis of energy consumption among 8 sectors to achieve National Target • Establishment of Baseline : • As per reported data of last 5 years (2005-06 to 2009-10) • Normalization Factor (capacity utilization) • Arithmetic Average of last 3 years value • Targets to be statistically calculated based on relative SEC approach after grouping the DCs suitably • The target reviewed by an expert committee before notification
General Rules for Establishing Baseline • Definitions: • Baseline Year : 2009-10 • Baseline Production (Pbase) : Avg. of 2007-8, 2008-9 & 2009-10 • Baseline SEC (SECbase) : Avg. of 2007-8, 2008-9 & 2009-10 • Baseline CU% (CUbase) : Avg. of 2007-8, 2008-9 & 2009-10 • Target SEC (SECtarget) : SEC as estimated in 2014-15 • Target : % reduction from SECbase • Estimation of Energy Saving (MTOE) : P base ( SEC base – SEC target )