Download

1 / 17
170 likes | 381 Views
ASAR IMP Image Quality Peter Meadows & Trish Wright. Properties of IMP Products Example IMP Products Analysis Approach Format Verification Impulse Response Function Measurements. Equivalent Number of Looks and Radiometric Resolution Azimuth Ambiguities Localisation Accuracy

E N D
ASAR IMP Image Quality Peter Meadows & Trish Wright • Properties of IMP Products • Example IMP Products • Analysis Approach • Format Verification • Impulse Response Function Measurements • Equivalent Number of Looks and Radiometric Resolution • Azimuth Ambiguities • Localisation Accuracy • Noise Equivalent Radar Cross-Section • Summary
Ground range detected imagery Single polarisation (VV or HH) Elevation antenna pattern and range spreading loss corrections applied Size of up to 150Mbytes with 2 byte (16bit) amplitude pixel values Swath widths of 100 km (IS1) to 56 km (IS7) with azimuth extents of ~100 km Azimuth resolution of 20.7m (4 looks of 320 Hz) Range resolution from 21m (IS2 far range) to 37m (IS1 near range) and ~26m for IS3 to IS7 12.5m by 12.5m pixels (hence under-sampling for spatial resolutions less than 25m) Properties of IMP Imagery
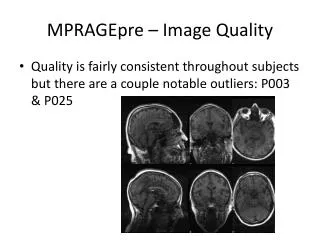
Example IMP Products 13 March 2002 IS5 VV 22 April 2002 IS5 VV
4 Aug 2002 IS4 VV Resolute 23 May 2002 IS4 VV Saskatchewan
Format verification using EnviView & the ESA SAR Product Control Software (developed by DLR & BAE Systems) Image analysis performed using SAR Control Software (point target & calibration modules) and following the ESA document on Quality Measurement Definitions for ASAR products Analysis Approach Format Verification • No problems identified with IMP format or header parameters
IRF parameters have been derived using the ESA transponders in The Netherlands, the Radarsat transponders in Canada, and the Neustrelitz ground station in Germany (all VV polarisation): Impulse Response Function Measurements Aalsmeer Edam Fredericton Ottawa Neustrelitz Swifterbant Zwolle Resolute Saskatchewan
Example Impulse Response Functions i = 19.54°, Azimuth Resolution = 22.76m, Range Resolution = 28.13m i = 25.94°, Azimuth Resolution = 22.56m, Range Resolution = 22.10m
Azimuth resolution (y): 22.02±0.53m (c.f. ~20.4m theoretical value, +10% limit & 30m requirement) Range resolution (x): (c.f. theoretical values, +10% limit & <38m requirement for IS1 and <30m requirement for IS2 - IS7) Spatial Resolution (3dB width of IRF): Note that the IS1 swath extends to 22.2° and that the IS2 swath starts at 19.2°.
-13.09±0.79dB (c.f. -12.4dB theoretical value, +5dB limit & <-12dB requirement) Integrated Sidelobe Ratio (ratio of energy in the sidelobes up to a box 20x by 20y to the energy in the mainlobe(2x by 2y)): Peak Sidelobe Ratio (ratio of the intensity of the most intense peak outside the main lobe up to 10x by 10y to the energy in the mainlobe): • -16.52±0.87dB (c.f. -21.2dB theoretical value, +5dB limit & <-20dB requirement) Spurious Sidelobe Ratio (ratio of the intensity of the most intense peak outside 10x by 10y up to 20x by 20y to the energy in the mainlobe): • -22.21±2.43dB (c.f. <-25dB requirement)
Note that the measured Peak Sidelobe Ratio is higher than the theoretical value and the requirement because of the under-sampling of the imagery. The spurious sidelobe ratio requirement is not meet for the same reason. Processing an IMP product with 9m pixels gives an adequately sampled image: Pixel Size 9m 12.5m width3dBx 25.25 m 25.22 m width3dBy 21.02 m 21.87 m ISLR -13.57 dB -13.32 dB PSLR -19.55 dB -14.48 dB SSLR -28.90 dB -20.85 dB measured_rcs 116.77 dB 116.80 dB
Mean equivalent number of looks: 3.69±0.11 (c.f. 3.9 theoretical value, -10% limit) Mean radiometric resolution: 1.82±0.02dB (c.f. 1.78dB theoretical value) Equivalent Number of Looks and Radiometric Resolution Equivalent number of looks and radiometric resolution are derived using uniform distributed targets. The radiometric resolution is a measure of the ability to distinguish between uniform distributed targets with different radar cross-sections. VV polarisationmeasurements:
ASAR Transponders: -25.8±2.1dB Kiruna ground station: < -22.7±2.4dB Azimuth Ambiguities As Doppler frequencies can only be distinguished modulo the PRF, azimuth ambiguities occur within the azimuth antenna pattern sidelobes. Measurement requires either very bright point target or a bright point target with a low ambiguity background radar cross-section. Average ambiguity ratios (all VV polarisation): The requirement is -25dB while the worst case prediction is ~ -27.9dB.
Measurements based on products processed with extracted chirps Mean range displacement: -174.3±86m Mean azimuth displacement: -4.9±30.3m Mean displacement: 178.5±82.5m Localisation Accuracy The difference between the measured and predicted positions of the ASAR transponder deployed in The Netherlands. The predicted positions are based on image header parameters, the known location of the transponders and their time delay. The transponders have a small terrain height and hence a small range terrain displacement.
For Orbit 670 (IS2), the localisation improves from 138.3±9.6m to 101.9±9.0m (3 transponders) For Orbit 706 (IS4), the localisation improves from 108.2±4.4m to 78.6±9.1m (2 transponders) The localisation accuracy requirement is <900m while the worst case prediction is ~75m in azimuth and between ~125m (IS1) and ~50m (IS7) in range. Using a nominal chirp instead of an extracted chirp improves the localisation accuracy (with predicted orbit data), e.g:
Noise Equivalent Radar Cross-section NESigma0 estimated using low radar cross-section regions (ocean, open water or lakes). This gives an upper limit to NESigma0. 27/07/02 IS2 VV 16/07/02 IS7 VV
NESigma0 estimated for VV polarisation using an estimated calibration constant. The minimum measured values are generally lower than the predicted values, especially at higher incidence angles.
No format problems identified Azimuth & range resolutions and ISLR acceptable. PSLR & SSLR outside expected range due to IMP under-sampling. Equivalent number of looks and radiometric resolution acceptable for all swaths Azimuth ambiguities acceptable for all swaths Localisation accuracy outside the expected values - improvements when using nominal rather than extracted chirps Noise equivalent radar cross-sections generally lower than the predicted NESigma0. Summary