Download

1 / 27
270 likes | 406 Views
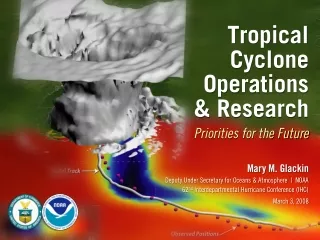
Tropical Atmospheric Research in Singapore. Asst. Prof. Tieh-Yong Koh 许 智扬 Nanyang Technological University (NTU) 南洋理工大学 19 Mar 2007. Acknowledgements: Naval Research Laboratory, USA Meteorological Service Division, National Environment Agency, Singapore

E N D
Tropical Atmospheric Researchin Singapore Asst. Prof. Tieh-Yong Koh 许 智扬 Nanyang Technological University (NTU) 南洋理工大学 19 Mar 2007 • Acknowledgements: • Naval Research Laboratory, USA • Meteorological Service Division, National Environment Agency, Singapore • Centre for Remote Imaging, Sensing and Processing, National University of Singapore
Malay Peninsula Singapore Typhoon Vamei Sumatra Island Borneo Island Equator Satellite picture taken by MODIS-TERRA at 11:33 am on 27 Dec 2001 Singapore Time. With courtesy from Centre for Remote Imaging, Sensing and Processing, National University of Singapore (CRISP/NUS)
Severe Weathere.g. TyphoonVamei, 27 Dec 2001 • In Singapore, 28 flights were diverted and 22 flights were delayed at Changi International Airport. • In hardest hit Johor and southern Pahang in Malaysia, the storm took away 5 lives and forced the evacuation of 7000 people.
26 Oct 2002, 9:38 am PSI24h=64, low moderate 15 Oct 2002, 9:25 am PSI24h=92, high moderate Atmospheric Pollution ~1.4km away • Smoke-haze pollution from forest fires
Channel NewsAsia International Online report on 15 May 2006 • Volcanic eruptions e.g. Merapi in Aug 2003, May 2005… Merapi Volcano, Central Java, 24 Aug 2003
Climate Change Global warming from increased CO2 levels, leading to: • increase in sea level; • redistribution of temperature, humidity & rainfall; • changes in storm frequency, duration and intensity. Larsen B ice shelf and parts of Antarctic Peninsula
COAMPS Real-Time Forecast System A project of Tropical Weather Group, TL@NTU Team Members Tieh-Yong KOH Lan YI Chee-Kiat TEO Numerical Weather Prediction
COAMPS Real Time Forecast • Model Description • System Features • Process Flow • Web Display • Verification: case study
Objective To create a automated system capable of timely delivery of reliable 24h-forecasts for the SE Asia region • The Tropical Weather group acquired the COAMPS model from Naval Research Laboratory, USA, for research purposes from Feb 2002 and has been running and testing the model ever since. Development work is still on-going. • A trial version of the automatedReal Time Forecast System is currently run at TL@NTU since July 2006. This version is being presented to you now.
Model Description • COAMPS stands for Coupled Ocean/Atmosphere Mesoscale Prediction System. • It is a mesoscale numerical weather prediction (NWP) model for regional weather forecast. • The current version is implemented on a 64-cpuLinux PC cluster. • It has customizable vertical and horizontal grid resolutions and is capable of horizontal nesting. • It uses up-to-date numerical methods and has a suite of complex physical parameterizations.
3D non-hydrostatic compressible equations • 11 prognostic variables: u, v, w, θ, , q, qc, qi, qr, qs , e • Terrain-following σz-coordinates • Limited-area model with grid-nesting option • Mercator projection used for the tropics • Initial and boundary conditions from NOGAPS (Navy Operational Global Atmospheric Prediction System) • Data analysis by Multi-Variate Optimal Interpolation
Physics modules: • radiative transfer (Harshvardhan et al., 1987) • cumulus convection (Kain & Fritsch, 1993) • cloud microphysics (Rutledge & Hobbs, 1983) • boundary-layer turbulence (Mellor & Yamada, 1982) • surface sub-layer physics (Louis, 1979) • simple land surface model (Deardorff, 1978) • coupled ocean data assimilation scheme(CODA) • time-dependent lateral boundaries(Davies, 1976) • Finite-difference method on staggered Arakawa C-grid • Split-time integration
System Features The COAMPS Real Time Forecast System is developed in-house at TL@NTU, based on the model and post-processing source codes provided by NRL. The following are the features of the system: • Automated routine forecasts • DATA DOWNLOAD: wget from data server, convert GRIB format to IEEE flat files readable by COAMPS analysis module • ASSIMILATION & FORECAST: supply model date time group and previous date time group with consistency • GRAPHICAL INTERFACE: post processing forecast outputs and visualize the results using batch GrADS scripts • WEB DISPLAY: sftp to web server, and update the time stamp on the webpage
Smart troubleshootingthat detects and solve ad-hoc problems automatically: • when wget is interrupted, missing files are identified and wget is attempted until the dataset is complete. (*There are 852 NOGAPS files + 7 ADP & OCN files) • computer nodes that are down are detected and the model domain decomposition is adjusted for MPI-processing. • aborted forecast jobs are detected and post-processing is performed as long as >24 hr forecast has been accomplished. • Twice daily data assimilation and forecast at 00Z and 12Z. Forecast products are available by 08Z and 20Z. (Future plans: 00Z, 06Z, 12Z and 18Z) • 3-level nesting with 9km-resolution in the innermost domain for mesoscale predictions. (Future plans: up to 5-level nesting with resolutions at 3km, 1km)
20 min – 1 hr Process Flow • Start WGET: • NOGAPS forecast • APD data • OCN data 10 min • Preprocessing • downloaded data: • Format change • Directory Change 1 – 2 hr Improvement • Execute COAMPS • Analysis • Forecast • Post processing SGT SFTP results to Web Server 20 min World-wide Observations Verification Forecast results available on the web by 4am & 4pm SGT (08 & 20 UTC) Investigation
Web Display • The web display was developed in consultation with Meteorological Services Division, National Environment Agency, Singapore to ensure its utility and friendliness to operational forecasters. • Putting COAMPS forecast products online • ensureseasy accessibility of from anywhere with internet connectivity. • facilitates communication with forecasters, model developers and research scientists. • Features of the web portal: http://www1.spms.ntu.edu.sg/~sunshine/ • Quick-look displays of a subset of meteorological variables of interest to forecasters; • Animated, frame-by-frame and all-at-once displays of time evolution of a particular variable • Latest and next older forecasts are available.
Verification: case study Thunderstorms in Singapore and Southern Malay Peninsula 17th-20th Dec 2006 * Start: Morning, Sunday 17 Dec * Peak: Tuesday 19 Dec * Movementnorthwards: Wednesday 20 Dec * Reduction: after 20 Dec
SINGAPORE • From the article “Singapore Swimming” on TODAYonline • Rainfall recorded from 12am to 8pm,19 Dec 2006 was 345mm (cf. climatological average for the whole month of December is only 284mm); • Highest 24h-rainfall recorded in Singapore was 512mm in 1978; • Second highest was 467mm in 1969. Mudslide at Little Guilin Tree uprooted at Hillview Wall caved-in at Mohd Sultan Johor-Singapore rail service disrupted Floods in Thomson & Mandai
PENINSULA MALAYSIA “…what we saw in Johor was not even recorded in the last 100 years.” -- Director-general Datuk Keizrul Abdullah, Drainage and Irrigation Department (DID), Malaysia 104,000 peopleevacuated!
Radar observations (courtesy of Malaysian Met Dept) 8 am (00 UTC) 17 Dec 2006 Forecasted ONSET: 2-5am 17 Dec ? 8 pm (12 UTC) 17 Dec 2006 Forecast of the Onset on 17 Dec COAMPS 48h-forecast initialized from 8 pm (00 UTC) 15 Dec 2006
Enhancement of Rain on 19 Dec COAMPS 36h-forecast valid at 8 pm 19 Dec 2006 Radar Observations at 8 pm 19 Dec 2006 (Courtesy of Malaysian Met Dept)
? Northward Migration of Rain Centre on 20 Dec (a recess of rain in Singapore) COAMPS 12h-forecast valid at 8 am 20 Dec 2006 Radar Observations at 8 am 20 Dec 2006 (Courtesy of Malaysian Met Dept)
COAMPS Performance • COAMPS captured the beginning of the heavy rain episode. Forecast made on 8 pm Friday 15 Dec predicted the onset of continuous precipitation in Singapore from 2-5am Sunday 17 Dec 2006 (i.e. > 1 day in advance). • But the agreement on detailed rainfall distribution varies inconsistently from good to below average… Expected from a 48h-forecast at mesoscales (~10km)? • COAMPS captured the enhancement of rainfallin Singapore on Tuesday 19 Dec 2006. • COAMPS captured the northward migration of the heavy rain patch from 19 Dec to 20 Dec 2006 but locations differ.
On-going work • 2-month statistical verification over SCSMEX period (May-June 1998) • Doppler Radar Data Assimilation • Satellite Data Retrieval