5.1 Polynomial Functions
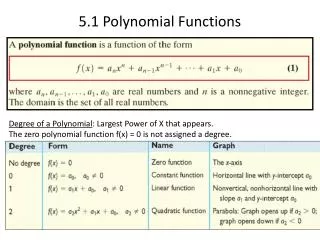
5.1 Polynomial Functions. Degree of a Polynomial : Largest Power of X that appears. The zero polynomial function f(x) = 0 is not assigned a degree. Identifying Polynomial Functions. Zeros of Polynomial Functions. Example: Find a polynomial of degree 3 whose zeros are -4, -2, and 3.

5.1 Polynomial Functions
E N D
Presentation Transcript
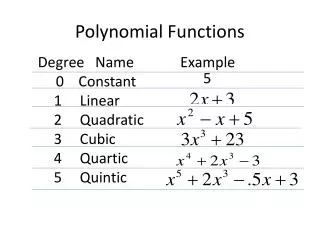
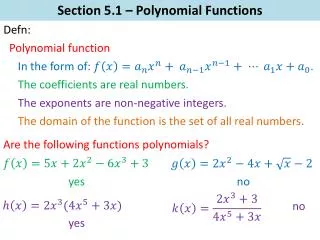
5.1 Polynomial Functions Degree of a Polynomial: Largest Power of X that appears. The zero polynomial function f(x) = 0 is not assigned a degree.
Zeros of Polynomial Functions Example: Find a polynomial of degree 3 whose zeros are -4, -2, and 3
Identifying Zeros and Their Multiplicities For the polynomial, list all zeros and their multiplicities. 2 With multiplicity 1 -1 with multiplicyty 3 3 with multiplicity 4
Leading Coefficient Test for End Behavior End Behavior : The behavior of a graph for large values of | x | • Even-degree polynomial functions have graphs with the same behavior at each end. • Odd-degree polynomial functions have graphs with opposite end behavior. • Note that the degree is even.
For the polynomiallist the zero and its multiplicity and whether it touches or crosses the x axis at each x-intercept.
Which of the following polynomial functions might have the graph shown?
5.2 & 5.3 Graphing Rational Functions Rational functions are quotients of polynomial functions. The following are examples of rational functions. Can you find the domains? (All real numbers except values that make the denominator zero) f(x) = x2 + 7x + 9f(x) = x2 – 9g(x) = x h(x) = x + 3 x(x – 2)(x + 5) (x – 3) (x2 – 9) x2+ 9
y y y y f x = a x = a f x x x x a a a a f x = a x = a f Arrow Notation Symbol Meaning xa+x approaches a from the right. xa-x approaches a from the left. xx approaches infinity (x increases without bound) x-x approaches negative infinity (x decreases without bound) The line x = a is a vertical asymptote of the graph of a function f if f(x)increases or decreases without bound as x approaches a. f (x) as xa+f (x) asxa– f(x) as xa+ f(x) - as xa- f (x) or f(x)-as x approaches a from either the left or the right. Vertical asymptotes occur at all x’s where the ‘simplified’ denominator is zero.
y y y y = b y = b f f f x y = b x x Finding Horizontal Asymptotes The line y = b is a horizontal asymptote of the graph of a functionf if f(x) approaches b as x increases or decreases without bound. f(x) bas xf(x) bas xf(x) bas x Let: The degree of the numerator is n. The degree of the denominator is m. If n<m, the x-axis, or y=0, is the horizontal asymptote of the graph of f. If n=m, the line y = an/bm is the horizontal asymptote of the graph of f. If n>m,the graph of f has no horizontal asymptote. Note : In contrast to vertical asymptotes, at most 1 horizontal asymptote exists and the graph may cross the horizontal asymptote.
7 6 5 4 Slant asymptote: y = x - 1 3 2 1 -2 -1 1 2 3 4 5 6 7 8 -1 Vertical asymptote: x = 3 -2 -3 Slant/Oblique Asymptotes • A slant asymptote exists if the deegree of the numerator is one • more than the degree of the denominator. • To find the equation of the slant asymptote, divide x- 3 into x2- 4x – 5, and drop the remainder. The asymptote is given by the resulting linear equation. • The equation of the slant asymptote is y=x- 1. Degree 2 Degree 1 3 1 -4 -5 3 -3 1 -1 -8
Strategy for Graphing a Rational Function • f(x) = p(x) ,where p(x) and q(x) are polynomials with no common factor. • q(x) • 1. Determine whether the graph of fhas symmetry. • f (-x) =f (x): y-axis symmetry f (-x) =-f (x): origin symmetry • Find the y-intercept (if there is one) by evaluating f (0). • Find the x-intercepts (if there are any) by solving the equation p(x) = 0. 4. Find any vertical asymptote(s) by solving the equation q (x)= 0. 5. Find the horizontal asymptote (if there is one) 6. Plot points between and beyond each x-intercept and vertical asymptote. 7. Use the information obtained previously to graph the function.
Which of the following is the graph of the equation: A) B) C) D)