Download
1 / 23
230 likes | 400 Views
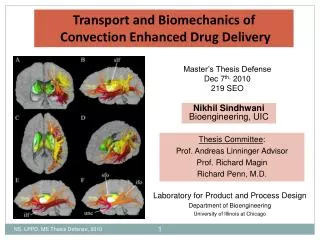
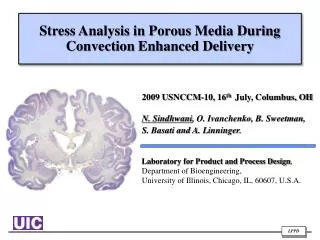
Stress Analysis in Porous Media During Convection Enhanced Delivery. 2009 USNCCM-10, 16 th July, Columbus, OH N. Sindhwani , O. Ivanchenko , B. Sweetman , S. Basati and A. Linninger. Laboratory for Product and Process Design , Department of Bioengineering,

E N D
Stress Analysis in Porous Media During Convection Enhanced Delivery 2009 USNCCM-10, 16th July, Columbus, OH N. Sindhwani, O. Ivanchenko, B. Sweetman, S. Basati and A. Linninger. Laboratory for Product and Process Design, Department of Bioengineering, University of Illinois, Chicago, IL, 60607, U.S.A.
Motivation A Reflux during experiment in agarose gel. Images from Sampson et al, 2007. T1 weighted MRI scans in human. I123-labeled human serum albumin. USNCCM-10 July 2009
Outline USNCCM-10 July 2009
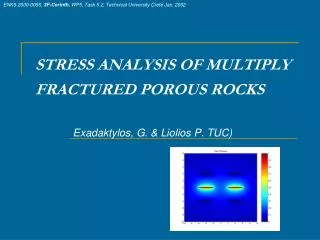
Experimental Stress Visualization • Theory of Photoelasticity: • Mechanical birefringence, or, stress refringence • Light refracted along the principle stress axes. • Stress field related to materials’ refractive indices with the Maxwell’s stress optic law. Linear Polariscope σ2 σ1 E E2’ E1’ σ1 σ2 E1’’ E2’’ Axis of polarization Axis of polarization Plane Polarized Light E E2 E1 Retardation E Analyzer Point of Interest Collimated light source Polarizer USNCCM-10 July 2009
Photoelasticity experiments Analyzer Polarizer Fig: Images taken from a plane polariscope. USNCCM-10 July 2009
Application of stress analysis: Preliminary experiment USNCCM-10 July 2009
Experimental displacement measurement Gel seeding Digital camera Setup Catheter attached to syringe pump 10X objective Gel Sample Image acquisition Syringe Pump 100X Image Processing USNCCM-10 July 2009
Gel seeding and image acquisition • Black Polystyrene nanoparticles (400nm) were seeded homogenously gel matrix. • Enough particles in catheter plane. • Infusion was done at 5μl/min (1hr). • ImageJ used to qualitatively ascertain the presence of displacement. Direction of infusion Seeded region Catheter Initial Image Final Image USNCCM-10 July 2009
Calculation of Cross-correlation function • Cross correlation function used to measure the displacement. • Double correlation used. • Initial window size of 128x128 and final size 64x64 pixels. • ISSN DPIV software was used. USNCCM-10 July 2009
Displacement vectors USNCCM-10 July 2009
Displacement Field (magnitude) USNCCM-10 July 2009
Displacement Field (Vertical direction) USNCCM-10 July 2009
Displacement Field (Horizontal direction) USNCCM-10 July 2009
Porosity change USNCCM-10 July 2009
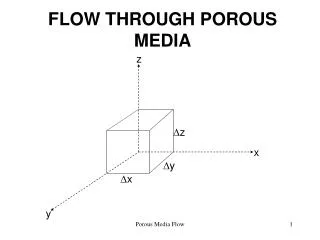
Finite element modeling using ADINA 2D model of gel chamber with catheter. Solid nodes: 17141 Fluid nodes: 4401 Free Surface Catheter wall: 2D solid 2D Fluid FSI boundary 2D Porous zone Wall boundary USNCCM-10 July 2009
ADINA simulation of Displacement Field (Vertical direction) USNCCM-10 July 2009
ADINA simulation of Stress Field (Vertical direction) USNCCM-10 July 2009
Simulation of reflux Hypothesis: porosity increases near the catheter walls due to stress. Modeled with high porosity near the catheter walls. USNCCM-10 July 2009
Conclusions • Stress and displacement can affect transport in porous media due to positive pressure infusion. • Stress in agarose gel visualized experimentally using photoelasticity. • Novel method for experimentally measuring displacement in gel matrix was developed. • Maximum displacement 6.5μm. • Resolution (minimum displacement recorded): 0.5μm. • Finite element model for gel under infusion was developed using ADINA. • The experiments and simulated profiles match qualitatively. • Current model does not account for matrix deformation due to infusion. USNCCM-10 July 2009
Acknowledgements • LPPD Members • Undergraduate researchers: George Tsiagalis, Komal Prem. • Partial support for this research was provided by: NSF CBET 0730048, NSF RET EEC 0743068, NSF REU EEC 0754590 USNCCM-10 July 2009
Thank You USNCCM-10 July 2009