1 / 4

Chart 1 Number of Respondents by Agency N=216

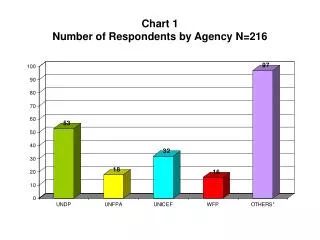
Chart 1 Number of Respondents by Agency N=216. Chart 2A Profile of Duty Station surveyed by Region, N=58 (Red – Number Contacted) (Blue Number of Responses). Chart 2B Profile of Responses Per Duty Station by Region Absolute Frequencies N=213.

inga-decker
Download Presentation

Chart 1 Number of Respondents by Agency N=216

An Image/Link below is provided (as is) to download presentation Download Policy: Content on the Website is provided to you AS IS for your information and personal use and may not be sold / licensed / shared on other websites without getting consent from its author. Content is provided to you AS IS for your information and personal use only. Download presentation by click this link. While downloading, if for some reason you are not able to download a presentation, the publisher may have deleted the file from their server. During download, if you can't get a presentation, the file might be deleted by the publisher.

E N D

Presentation Transcript


  1. Chart 1Number of Respondents by Agency N=216

  2. Chart 2AProfile of Duty Station surveyed by Region, N=58(Red – Number Contacted) (Blue Number of Responses)

  3. Chart 2BProfile of Responses Per Duty Station by RegionAbsolute Frequencies N=213

  4. Chart 3Profile of Respondents N= 236 from 42 out of 57 country locations

More Related