Download
1 / 36
370 likes | 535 Views
Synthesis Integrating Climate-Water-Ecosystem Science. Murugesu Sivapalan University of Illinois, Urbana-Champaign. Objective: 2. To use the synthesis activities as test cases to evaluate the effectiveness of different modes of synthesis for advancing the field of hydrologic science.

E N D
Synthesis Integrating Climate-Water-Ecosystem Science MurugesuSivapalan University of Illinois, Urbana-Champaign
Objective: 2 To use the synthesis activities as test cases to evaluate the effectiveness of different modes of synthesis for advancing the field of hydrologic science Principal Investigators: MurugesuSivapalan, Praveen Kumar, Bruce Rhoads, Don Wuebbles Water Cycle Dynamics in a Changing EnvironmentAdvancing Hydrologic Science through Synthesis Objective: 1 To organize and employ synthesis activities to produce transformational outcomes that will be utilized to improve the predictability of water cycle dynamics in a changing Earth environment.
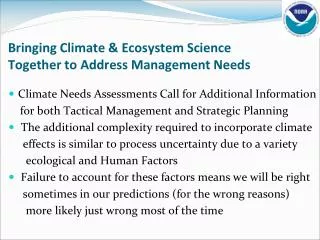
Water Crisis: A crisis in water management • Water management in the context of fast increasing demand (e.g., population increase), degradation of an already poorly distributed resource base, in the presence of considerable uncertainty (e.g., due to climate change), and subject to significant social and economic bottlenecks
Water Crisis: Solution Strategies • Social: population control, lifestyle changes, recycling, policy development • Technology: agricultural (irrigation, rainwater harvesting, plant breeding), recycling • Economics: pay for ecosystem services, fair price for water, enhancement of trade • Science: predict water cycle dynamics under global change amid uncertainty, predict resource availability and hazards, and help value and protect the environment from further degradation
What do we observe? How do we analyze? How do we predict? • Matter and Forces • Mechanistic perspective • Patterns and processes • Evolutionary perspective Could there be a broadening of our perspectives? Could there be a synthesis?
Open/Dissipative System Paradigm • Natural systems don’t exist – they evolve. • The evolution is driven by the exogenous variability imposed on them by weather, climate and anthropogenic factors, and endogenous variability generated by the subsystems as a result of the adaptive process. • The variability allows the system to explore a variety of statesto find an optimal one for its sustenance during the evolutionary process. • The response of the system, which we are most concerned with, evolves along with the evolution of the system itself giving rise to combinatorial or co-operative effects new functional (emergent) patterns arise from the systematic alterations of historically discrete configurations of functional relationships Praveen Kumar
Working Hypothesis: Learning from Patterns • Patterns help us to reduce the complexity through reduced dimensionality, and thus help to improve predictions • Patterns (both observed and so far unobserved) are emergent properties arising out of complex interactions and feedbacks between a multitude of processes. • Study of patterns (how to describe them, why they emerge, their impact on the overall response) yields new insights and lead to increased understanding. • Study of observed patterns (why they emerge) may give insights into unobservable or as yet unobserved patterns, and help to make improved predictions
Summary of Approach • Data based: recognize/extract patterns from data • Patterns needing a multitude of perspectives from different disciplines to explain or interpret • Interpretation of patterns using parsimonious models: a top-down approach • What are the minimum processes needed to describe strong physical, chemical and biological coupling over a wide range of spatial and temporal scales? • How do complex highly heterogeneous physical, chemical and biological systems respond to changes in forcing behavior and system structure? • Comparative hydrology: develop generalizable insights through comparisons and classification • Summer Synthesis Institute in Vancouver, June-July 2009
Theme #1:Interactions between hydrosphere and biosphere processes Water balance partitioning at the catchment scale Peter Troch, Ciaran Harman and Sally Thompson
The Horton Index Proportion of available water vaporized Precip “Fast” runoff ET Wetting “Slow” runoff Annual Evapotranspiration HI = Annual Wetting
Pattern that intrigues….. V : Growing-season vaporization (E+T) W : Growing-season wetting (P-S) “The natural vegetation of a region tends to develop to such an extent that it can utilize the largest possible proportion of the available soil moisture supplied by infiltration” (Horton, 1933, p.455) Horton, 1933 (AGU)
HortonIndex vs. Humidity Index Between years Between catchments Pattern that intrigues….. Annual Precipitation Humidity Index = Troch et al., 2009 (HP) Annual Potential Evaporation
Three approaches explain HI Pattern Process Function HI
... all three predict the mean Uncalibrated Calibrated Pattern Function Process
Predictions of inter-annual variability raise questions about their process controls Pattern Function Process Timing of rainfall, vegetation response, landscape change, topography?
Hypothesis ? ? ?
Rn VPD LAI U P T Models of landscapes as nonlinear filters Penman Monteith Model PPT Interception Model E Emax Infiltration Runoff Multiple Wetting Front Model T Root Water Uptake Model Drainage
Working Paradigm Classic ecohydrological approach: ETmax ~f(Rn, VPD, LAI,T) ET ~ ETmax * f(θ) “Water-limited” paradigm? Plant control of ET?
Soil Moisture Drydown v ET ET correlates to soil moisture Kendall ET (mm/hr) or θ % Days ET increases as soil moisture declines! Sky Oaks ET Soil Moisture ET (mm/hr) or θ % Days
Adding Groundwater Improves Prediction ET (mm/hr) Month
Phenology Changes Seasonality of ET Howland Forest, Maine C B Normalized ET, LAI and Rn C B A A Week
Theme #2: Interactions of landscape processes within intensively managed watersheds Sediment and Contaminant Dynamics Across Scales NanditaBasu, Ciaran Harman, Sally Thompson
Patterns that intrigue….. Why are they linear? Or, Why are watersheds chemostatic? At what scale are they chemostatic? And why? Nitrate load-discharge relationships across Mississippi Sediment load-discharge relationships
Filtering of solute variability across scales: Study Sites Single Tile Drain Mississippi Basin Little Vermilion
Hypothesis: Landscapes act as cascading,coupled filters Observed “patterns” are windows into this filtering Filtering of variable inputs by landscape structure and biogeochemical processes produces PATTERNS, as water and solutes cascade across spatial and temporal scales
HEIST: A 1-D event-based model of solute loads filtered by the vadose zone
Model reveals controls on clustering of events and emergence of extremes Effects of soil depth: Effects of degradation rate: Increasing degradation rates Increasing depth Solute mass out Solute mass in Clustering in time Increased non-linearity of filter “Extreme outcomes driven by normal inputs” Clustering of transported mass
Multiple models used to test hypotheses about origins of observed patterns MRF model - Conceptual hillslope coupled to network THREW model - Representative Elementary Watershed Storage-dependent CSTR model Multi-compartment flow and BGC process model Storage
Chemostatic Q – C behavior linked to: B) Interaction of forcing and filter timescales A) Storage – dependentreaction rates Reaction time Residence time Event input frequency C) Averaging effects of the network
Reach scale dependence on stage shown to produce catchment-scale inter-annual variability in N delivery Simon Donner (UBC) IBIS-THMB model simulations (65 sq km grid resolution) Bohlke 2008 In-stream N Removal Runoff (mm) REACH SCALE Inverse relationship between denitrification and stream depth Temporal averagingover year WATERSHED SCALE Inverse relationship between Annual flow and in-stream removal Spatial averaging over network
Reach-scale process emerge at larger scales despite time-space averaging Reach scale parameterization k = 0.06/h Watershed scale behavior k ~ Q-0.35 33 Emergent scaling? “Hydraulic BGC” k = 0.2/h 33
Synthesis process • Summer institute adopted as the mode of synthesis this year; this turned out to be a success • Short time frame (~6 weeks), team effort (students, mentors), preparation before and follow-up after • Grassroots level activities and discussions led to the themes adopted for the summer institute • Freedom to experiment with ideas, yet targeted towards realizable goals, with a “trail blazing” aspect • Selection of mentors and students brought together was predicated on the need to represent diverse disciplines and a broad range of technical skills.
Conclusions • Transformative outcomes: • Models of the Horton Index and Links between Horton Index and vegetation response, topography • New watershed modeling framework of watersheds as a hierarchical and nonlinear physical (hydrological and geomorphological) and biogeochemical filters • Order out of complexity: Landscapes, comprising of vegetated hillslopes and converging, fractal stream networks, act as nonlinear hierarchical dynamicfilters to modulate the random, stochastic input signals (rainfall, chemical inputs, etc.) to produce consistent and persistent emergent spatio-temporal patterns (Courtesy: Suresh Rao) • Possibly the evolutionary outcome of integrated climatic, biogeochemical, geomorphological, ecological, pedological feedbacks: what is their ecosystem function?
Additional Remarks (Suresh Rao) • Synthesis: “By combining ideas from hydrology, biogeochemistry, geomorphology etc. to build new, parsimonious models that recreated the patterns observed across scales and under varying forcing conditions.” In this sense “synthesis did occur” • Consilience: “the concurrence and convergence of induction drawn from synthesis of different datasets and model simulations.” What happened was more than synthesis, what emerged was element of consilience, a synthesis of synthesis, leading to unity of knowledge