Topics
240 likes | 449 Views
Topics. Reference interval studies The importance of seeing Parametric, Non-parametric and other Estimating the error of a reference interval study Sample size for a reference interval study Outlier exclusion Partitioning for age, sex or other Data mining techniques

Topics
E N D
Presentation Transcript
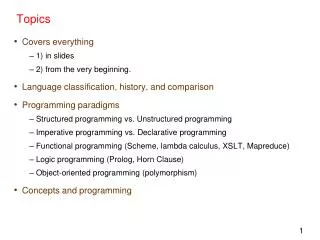
Topics • Reference interval studies • The importance of seeing • Parametric, Non-parametric and other • Estimating the error of a reference interval study • Sample size for a reference interval study • Outlier exclusion • Partitioning for age, sex or other • Data mining techniques • Requirements for reference interval sharing
The importance of seeing • This is a workshop on statistical techniques • The human brain is a very powerful mathematical engine • The best inputs are graphical not numerical • ALWAYS graph your data • ALWAYS think about your data
The importance of numbers • Which distribution is Gaussian? N=50 N=2000 Both!
Parametric statistics • Can be used on parametric distributions • Parametric distributions are those which can be described by parameters • Gaussian Distribution defined by 2 parameters: • Mean (average) – indication of the center • Standard deviation – indication of scatter • Symmetrical distribution (not skewed) • 68.3% within +/- 1SD • 95.4% within +/- 2SD • 99.7% within +/- 3SD
Non-parametric statistics • No assumptions about distribution • Percentiles determined by ranking • Measure of centre is median (50th percentile) • Measure of scatter is percentiles (eg 2.5th and 97.5th)
Non-parametric statistics • xth percentile is X × (n+1)th lowest sample • Example: 75th centile, n=138 75th = 0.75 x 139 th lowest sample = 104th lowest = 9
Non-Parametric - numbers • To determine two percentiles P% apart • Need at least (100/P)-1 observations • Examples • 95th Centile (separate from 90th) • Need (100/5)-1 = 19 observations • 97.5th Centile (separate from 95th) • Need (100/2.5)-1 = 39 observations • 99th Centile (separate from 98th) • Need (100/1)-1 = 99 observations
Robust Techniques • Methods giving more weight to the more common (central) values than to the peripheral results • Described by Amadeo Pesce • Estimating reference intervals with n=20! • Horne PS, Pesce AJ, Copeland BE. Clin Chem 1998;44:622-631. • Techniques not readily available *** • Data-mining techniques may be considered “robust”
Confidence Intervals • Reference interval studies are experiments • There is “Experimental error” • This is revealed when more than one reference interval study is performed. • Even if every other factor is the same, a different sampling of a population will produce a different result • The confidence interval of the Upper and Lower reference intervals describe this error
Statistical Imprecision of RI study • Estimates of reference limits has limitations • Expressed as the confidence interval of the Reference Limits, eg 90% CI of the upper and lower reference limits • Confidence intervals decrease as the number of people in the study increases. Large n Small n
CI - Parametric • Mean +{z1s +/- z2*SQRT[s2/n + (z12*s2)/2n]} • s = SD • n=sample size • z1 = probit value related to percentile (=1.96 for 97.5th percentile) • z2 = covering factor for confidence level (= 1.64 for 90%)
CI - Parametric • +/-2SD +/- 1.64*SQRT[s2/n + (1.962*s2)/2n]} • Mean = 20, SD = 10
EXAMPLE 2.5th Centile, n=250 97.5th = 0.025 x (n-1) = 0.025 x 249 = 6th lowest sample 90% confidence interval is 3rd to 12th lowest samples
Outlier exclusion • “some observation whose discordancy from the majority of the sample is excessive in relation to the assumed distribution model for the sample, thereby leading to the suspicion that it is not generated by this model.” • A vital part of a reference interval study using parametric or non-parametric statistics • Particularly difficult with “logarithmic” data • (BNP data)
Outlier exclusion • Dixons criteria • If D (distance of outlier from next sample) is > 1/3 x R (range of entire data set): exclude • For groups of outliers treat each individually • NCCLS, Horn and Pesce • Other: remove any data outside +/- 4SD • “Reliable statistical detection of outliers in reference interval data remains a challenge” • Solberg and Lahti, Clin Chem 2005;51:2326-2332
Distributions • Commonly “assumed” distributions • Gaussian • Square root • Logarithmic • More skewed
Box - Cox Transformations • A family of transformations y = (xλ - 1)/λ y = ln(x+c) λ=0 • Covers many forms of transformation λ = 1 linear transformation (unchanged) λ = 0.5 square root transformation λ = 0.2 skewed right (less skewed than log) λ = 0 (or close to zero) logarithmic transformation λ = -0.2 Heavily skewed right (more than log) λ < 0 “Over-log” transformation • Normalises data more skewed than log distribution
Transformations of ALT Raw dataLambda=1 LogarithmicLambda=0 “Over-Log” Lambda=-0.5 NHANES III: ALT, male, age 20 to 80, n=6423
NORIP STUDY Female ALT (n=1220) 11 19 27 33 41 49 57 ALT (U/L) Female URL: 45.6 (90% CI 42.5 – 49.3, n=1220) Male URL: 68 (90% CI 63.4 – 73.6, n=1080)
Partitioning • Provision of separate reference intervals for subgroups • Sex and age (paediatric & geriatric) most common • Others may include race, menopausal status, stage of gestation or menstrual cycle. • Historically Harris and Boyd has been recommended. • New theories • Lahti A et al. Clin Chem 2002;48:338-352
Lahti et al • Criteria depends on asterisk rate of subgroups when common intervals are applied. • <3.2% asterisk rate of either subgroup: NO • >4.1% asterisk rate of either subgroup: YES • In-between: consider other factors • Note: non-parametric approach also described • Very complex • Clin. Chem., May 2004; 50: 891 - 900.
Data Mining • Bhattacharya, LG. Journal of the Biometric Society. 1967;23:115-135. • Example data: Frequency Distribution of the forkal length of the Porgy caught by pair-trawl fishery in the East China Sea.
Bhattacharya • Assumptions • Gaussian or Log Gaussian distributions • Most results unaffected by reason for testing blood • Ideal for “profiles” • No systematic effect of source on results. Eg • Inpatients with low sodium and albumin • Outpatients with delayed separation • Beware • No confidence limits for results • User-influence on results