Enhancing EMS Operational Performance: Theoretical Models and Practical Strategies
590 likes | 713 Views
This presentation by Jonathan D. Washko explores the critical elements of operational performance in Emergency Medical Services (EMS). It emphasizes the necessity of timely patient access and addresses the interplay of training, resources, and strategies vital for EMS success. Key topics include the EMS Success Triad—comprising patient care, employee well-being, and financial stability—the Quality Unit Hour concept, and best practices for performance improvement. Join us to understand how to navigate the complexities of EMS operations and improve service delivery effectively.

Enhancing EMS Operational Performance: Theoretical Models and Practical Strategies
E N D
Presentation Transcript
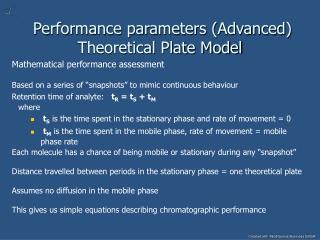
Improving OperationalPerformance The Theoretical Performance Model Presented by Jonathan D. Washko, BS-EMSA, NREMT-P Director of Deployment – REMSA President – Washko & Associates, LLC EMS Performance Improvement Consulting
An EMS Fact… • Understand that all the training, equipment, personnel, supplies, drugs, protocols, hardware, vehicles, technology, maintenance, QI systems etc, etc, etc don’t mean a thing if…
An EMS Fact… • Understand that all the training, equipment, personnel, supplies, drugs, protocols, hardware, vehicles, technology, maintenance, QI systems etc, etc, etc don’t mean a thing if… We Can’t get to the Patient in/on Time
Session Overview: • Homeostasis & The EMS Success Triad • Production Model EMS Theory & The Quality Unit Hour Concept • Understanding The Theoretical Performance Model • The Variables of Performance Improvement • Strategies / Best Practices for Performance Improvement • Performance Improvement Pitfalls & Tips • Summary / Review / Questions
Homeostasis & The EMS Success Triad • The Constant Balancing of 3 Key Elements • Patient Care • Employee Well-Being • Financial Success (however you define it) Success Triad Patient Care Economic Stability Employee Wellbeing
Homeostasis & The EMS Success Triad • Patient Care • Response Times • Clinical Performance • Customer Service Success Triad Patient Care
Homeostasis & The EMS Success Triad • Employee Well-Being • Retention • Health / Safety / Welfare • Satisfaction • Schedules • Work Environments • Compensation • Recruitment • Family Success Triad Patient Care Employee Wellbeing
Homeostasis & The EMS Success Triad • Financial Success • A/R Billing Practices • EMS Delivery Model & System Design • Operational Efficiency & Effectiveness • Employee Compensation • Safety & Risk Management • Systems Engineering • Profitability • Subsidy Needs Success Triad Patient Care Economic Stability Employee Wellbeing
Production Model EMS Theory QUESTION: Is EMS a Service Industry or Production Industry?
Production Model EMS Theory High Performance EMS Systems Believe… That EMS is a Production Industry that provides its customers with a level of Quality Service as an end result of a Quality Product
Production Model EMS Theory • Quality Services from Quality Products • Examples: • Radio / Boom Box. The quality of the sound, reception, etc. (Service) is based on the quality of the Radio (Product) • Televisions. The quality of the picture provided (Service) is based on the quality of the TV (Product) • Etc, etc, etc
Production Model EMS Theory • Quality Services from Quality Products • So what Widgets (or products) • do HPEMS Systems Produce?
A Quality Unit Hour • A “Quality Unit Hour” is an ambulance that is available to the EMS System for one hour that responds to properly triaged calls for service, is produced within a CQI environment that uses modern technology to collect and assess accurate data, is fully staffed, fully trained, fully maintained, fully stocked, properly placed in location and time, properly funded and safely operates within an educated population
The Quality Unit Hour Concept • Patient Care • Employee Wellbeing • Financial Stability Public Education Control Center Training & Edu Human Resources Finance Operations The Quality Unit Hour Supply / Logistics Data Analytics Safety & Risk QI / CQI / PI Fleet Maint. IT / Technology PR/Marketing
Production Model EMS Theory • The Quality Unit Hour • Manufacturing / Production Cycle • Based on Supply & Demand
Improving Performance • Assumes you understand the EMS Success Triad • Assumes you understand and/or operate under the Production Model EMS Premise • Assumes you understand the Quality Unit Hour Concept It’s never safe to assume so any questions before we move on?
Understanding The HPEMS Theoretical Performance Model • The HPEMS-TPM is a graphical representation of how HPEMS systems can progress over time in relation to the EMS Success Triad based on changing key deployment and performance variables. This enables visualization of great and not so great performance and the positive and negative tradeoffs associated with changing these performance variables. It also allows for a visual representation of HPEMS “Homeostasis” which is an achievable but difficult band in the TPM to reach and then maintain
Understanding The HPEMS Theoretical Performance Model • Empirically Driven “Common Denominator” Model Based on Years of HPEMS Exposure and Experiences • Variables (Color Coded) • Response Time Reliability / Performance • Patient Care • Productivity / Unit Hour Utilization / Profitability • Employee Well-being • Zones • Union Formation Zone • Contractual Danger Zone • Performance Comfort Threshold • Performance Improvement Zone • Triad Homeostasis • Unit Hour Reduction Zone / The Triad Tradeoff
Understanding The HPEMS Theoretical Performance Model - Variables Response Time Reliability / Performance
Understanding The HPEMS Theoretical Performance Model - Variables • Response Time Reliability / Performance • Depicts response time reliability based on fractile measurement • The further up the matrix the higher the performance, the lower on the matrix, the lower the performance • Response Time Goal depicts contractual or self imposed response time reliability standard • UHU Syndrome represents what can happen to many HPEMS systems when productivity drops too low
Understanding The HPEMS Theoretical Performance Model - Variables Patient Care
Understanding The HPEMS Theoretical Performance Model - Variables • Patient Care • Can represent many different aspects of patient care • Survival rates / outcomes • Customer Service Satisfaction • Assumes patient care is proportional to response times and employee well-being • The further up the matrix the better the patient outcome, the lower on the matrix, the lower the patient outcome
Understanding The HPEMS Theoretical Performance Model - Variables Productivity / UHU / Profitability
Understanding The HPEMS Theoretical Performance Model - Variables • Productivity / UHU / Profitability • Represents the typical productivity curves seen as HPEMS systems mature • Assumes profitability improves as performance and productivity increases • The further up the matrix the higher the performance, the lower on the matrix, the lower the performance • Profit Departure • When productivity hits a level of diminishing returns based on poor performance outcomes
Understanding The HPEMS Theoretical Performance Model - Variables Employee Well-being
Understanding The HPEMS Theoretical Performance Model - Variables • Employee Well-being • Represents employee satisfaction: • Turnover rates • Health / safety / welfare • Employee happiness • Good employee satisfaction survey scores • The further up the matrix the higher the satisfaction / less turnover, the lower on the matrix, the lower the satisfaction / higher turnover rates • Employees are the foundation of your organization • Note that employee satisfaction is the first to go as systems attain higher performance….why?
These Elements Should Look Familiar • The Homeostatic Balancing of 3 Key Elements • Patient Care • Employee Well-Being • Financial Success (however you define it - Productivity) Success Triad Patient Care Economic Stability Employee Wellbeing
Understanding The HPEMS Theoretical Performance Model - Zones
Understanding The HPEMS Theoretical Performance Model - Zones Union Formation Zone
Understanding The HPEMS Theoretical Performance Model - Zones • Union Formation Zone • Represents areas where HPEMS systems have typically unionized, mostly due to poor management communication / employee education or area specific cultural issues • Key Union Formation Areas • Beginning of a HPEMS System (largest change) • When attempting to improve performance by holding employees accountable for avoidable mistakes without balancing employee needs / understanding • Dramatic increase in productivity (employee workload) after performance improvement steps taken • When Job security is threatened (real or assumed)
Understanding The HPEMS Theoretical Performance Model - Zones Contractual Danger Zone
Understanding The HPEMS Theoretical Performance Model - Zones • Contractual Danger Zone • Represents an area where experienced operators shy away from when managing response time performance • Typically ½ to 1 percentage point above the minimal contractual requirement • Less experienced operators will sometimes try to manage their response times within this region, however they typically burn out their management teams and/or problems will begin to arise in operator trustworthiness / integrity • Primary reason an operator manages in this zone is due to poor financial performance (for a variety of reasons)
Understanding The HPEMS Theoretical Performance Model - Zones Performance Comfort Threshold
Understanding The HPEMS Theoretical Performance Model - Zones • Performance Comfort Threshold • Represents an area where most experienced operators manage response time performance to • Typically 1 to 2 percentage point above the minimal contractual requirement • Less experienced operators may get frozen in the left side of this zone not understanding that performance can be improved (What we will be discussing today) • Some performance based contract systems force their operators to live either on the left or right in this zone and are sometimes have disincentives to operate in the middle (at Triad Homeostasis), however some do receive performance bonuses for operating in the middle (through performance penalty forgiveness)
Understanding The HPEMS Theoretical Performance Model - Zones Performance Improvement Zone
Understanding The HPEMS Theoretical Performance Model - Zones • Performance Improvement Zone • Represents an area where experienced operators improve systemic system performance • Can increase compliance upwards of 3 or 4 percentage points based on approach that works for their particular system and / or contractual need without the need for additional unit hours • Takes time and patience to achieve and most successful systems wait to reap the financial rewards of this zone until the systems needed to manage improvement are in place, tested and are habitual • I believe the dollar pay-off for this is not as great as the patient care and employee well-being payoff (contrary to what many may believe), however there are financial rewards if taken advantage of
Understanding The HPEMS Theoretical Performance Model - Zones Triad Homeostasis
Understanding The HPEMS Theoretical Performance Model - Zones • Triad Homeostasis • The HPEMS Sweet Spot! • Where maximum response time reliability, best patient care outcomes and almost best employee-wellbeing collide • Purely due to the aggressive geospatial deployment methodologies needed to achieve this level of performance, employee well-being begins to wane • Notice that maximal financial performance is not yet achieved in this zone as they are typically competing (based on contractual requirements) although financial performance can come quicker if an agency chooses to do so • May bring into question the need for first-responder services for certain geographic areas within a service area as typically Ambulances will beat First Responder Services on scene (upwards of 60% to 70% of the time and sometimes higher)
Understanding The HPEMS Theoretical Performance Model - Zones UH Reduction Zone / Triad Tradeoff
Understanding The HPEMS Theoretical Performance Model - Zones • Unit Hour Reduction Zone / The Triad Tradeoff • Where profitability or availability of system funds will increase due to the lowering of unit hours • Lower Unit Hours come from an increase in production / UHU • Increased production / UHU comes from lowering response time reliability back into the Performance Comfort Threshold region • The Tradeoff • Patient care begins to drop from slower response times • Employee well-being will drop from increased workload demands • Other problems may arise if Performance Improvement Systems fail or apathy invades an operation
Understanding The HPEMS Theoretical Performance Model - Zones • Unit Hour Reduction Zone / The Triad Tradeoff • Additional Facts • Based on the make / model of your HPEMS system, the dollars and/or unit hours may be used for other things… • Acceptance of increasing call volume on a marginal cost basis • Better servicing of outlying (rural) service areas • Increasing contiguous service area size on a marginal cost basis • Attempting to shore up employee well-being though increased compensation, benefits, appreciation programs, etc.
Understanding The HPEMS Theoretical Performance Model - Zones Deployment Aggression Zone
Understanding The HPEMS Theoretical Performance Model - Zones • Deployment Aggression Zone • Defines (on a sliding scale) the impact of deployment tactics based on aggressiveness and approach. • A key and necessary element in Performance Improvement • Your success to performance improvement is directly correlated to how you do your deployment model • Least aggressive static models are on the far left side of the scale • Most aggressive dynamic pure SSM models are on the far right side of the scale • Everything in between is some form or mix of these two extremes
Understanding The HPEMS Theoretical Performance Model - Discussion
The Performance Improvement Zone • The Performance Improvement Variables… • Simple Stuff (low hanging fruit – can do tomorrow) • Data Integrity & Accuracy (is it) • Measurement / Reporting Systems (are they accurate) • Underlying Technology Systems (causing problems with data) • Chute Times (dispatch & unit) Clock Start to Physically En Route • Open Minded Management Team Capable of Change! • Intermediate Stuff (takes more time but can happen quick) • Educate entire team on HPEMS & SSM (VERY important!!!) • Temporal Supply & Demand Matching (do they?) • Deployment Plan Aggressiveness & Approach (simple or complex) • Open Minded Management Team Capable of Change! • Advanced Stuff (takes lots of time, patience & consistency) • Fix controllable response errors • Implement & USE Granular Accountability & Reliability Tracking Systems, find the problem areas and fix them • Implement & USE Real-time Situational Awareness Systems (based on data driven and human driven intelligence) to adjust as needed • Implement & USE Bleeding Edge Technology (don’t $kimp) • Open Minded Management Team Capable of Change!
The Performance Improvement Zone • Strategies for Performance Improvement… • Simple Stuff (low hanging fruit – can do tomorrow) • Data Integrity & Accuracy • Check data and dispatch practices / procedures to ensure accuracy…analysis is only as good as the data it is performed on • Reconcile missing data points (especially Call Lat / Long) • Perform internal audits of every late call to ensure they are in fact late (audit clock start and stop times) • Measurement / Reporting Systems • Make sure your data reporting systems used to measure response time performance are accurate and meet contractual obligations or internal standards
The Performance Improvement Zone • Strategies for Performance Improvement… • Simple Stuff (low hanging fruit – can do tomorrow) • Underlying Technology Systems • Check CAD to CAD interfaces, Atomic Clock Synchronizations and CAD system itself to ensure proper data collection accuracy & call processing efficiency • GIS systems are an integral part of today’s response systems. Ensure an up to date geo-database and attempt to achieve 100% accurate geo-validation of addresses (also check response zones) • Chute Times (dispatch & unit) • Measure, monitor & report on chute time performance at the granular (employee) level • Work to mitigate & remediate problems • Open Minded Management Team Capable of Change!
The Performance Improvement Zone • Strategies for Performance Improvement • Intermediate Stuff (takes more time but can happen quick) • Educate entire team on HPEMS & SSM (VERY important!!!) • A common denominator of ALL successful HPEMS operators • Provide advanced courses for management and supervisors • Provide basic courses for the rest of the crowd (including field) • Temporal Supply & Demand Matching (do they?) • Plot your Unit Hour supply against your Demand. Do they match? If not, adjust schedules and unit hour supply accordingly…yes it may be time for a shift bid • Be sure to incorporate call task time into the model as longer call task times require more resources (most demand models assume 1 call takes 1 hour) • Investigate why task times are long and mitigate if possible • Measure & Control Lost Unit Hours. Non-productive unit hours are commonly at the root of many performance problems
The Performance Improvement Zone • Strategies for Performance Improvement • Intermediate Stuff (takes more time but can happen quick) • Deployment Plan Aggressiveness & Approach • Aggressive Deployment Models • Hourly demand focused posting plans • Strategic & prioritized redeployment of resources after each call is assigned to a unit • Short post roaming distances, post to post moves, chute time tolerances • Typically use street corner posts only (quicker chute times) • Less Aggressive Deployment Models • Hour grouping of demand based plans • Strategic & prioritized redeployment of resources after each call is assigned to a unit • Longer post roaming distances, post to post moves, chute time tolerances • Typically use some stations intermixed with street corner posts