Performance parameters (Advanced) Theoretical Plate Model
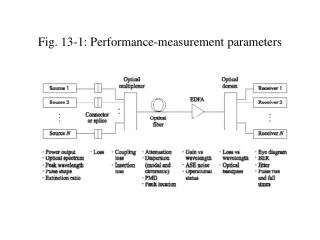
This document delves into the theoretical underpinnings of chromatographic performance through advanced mathematical models. Key parameters such as retention time, chromatographic efficiency, selectivity, and resolution are explored. Retention time is derived from the interplay between stationary and mobile phases. We discuss effective plate numbers, capacity factors, and their relationship to performance optimization. Essential metrics are outlined, including peak shape, resolution, and baseline stability, all crucial for achieving optimal separation and analysis times in chromatography.

Performance parameters (Advanced) Theoretical Plate Model
E N D
Presentation Transcript
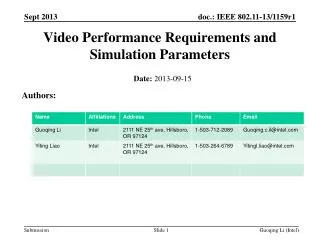
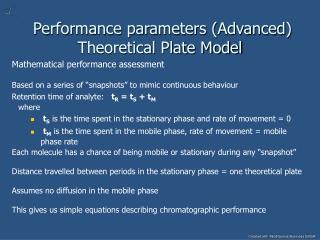
Performance parameters (Advanced) Theoretical Plate Model Mathematical performance assessment Based on a series of “snapshots” to mimic continuous behaviour Retention time of analyte: tR = tS + tM where • tS is the time spent in the stationary phase and rate of movement = 0 • tM is the time spent in the mobile phase, rate of movement = mobile phase rate Each molecule has a chance of being mobile or stationary during any “snapshot” Distance travelled between periods in the stationary phase = one theoretical plate Assumes no diffusion in the mobile phase This gives us simple equations describing chromatographic performance
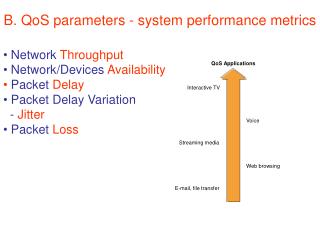
Performance parameters (Advanced) Chromatographic Efficiency Column Efficiency (measured by plate number: N) N = (tR/s)2 tR is total retention time, and s is the standard deviation of a gaussian peak BUT s requires accurate determination of points of inflection, so we use N= 5.54 x (tR / peak width at 50% height)2 Large N indicates good column performance (should be ~10,000 for HPLC) N is increased by: • increased temperature, column length • decreased stationary phase particle size, flow rate, mobile phase viscosity
Performance parameters (Advanced) Chromatographic Efficiency Other variants of chromatographic efficiency Effective N (Neff): If tR is low, then t0 affects apparent efficiency Neff = 5.54 x [(tR - t0) / peak width at half height]2 Plate Height (H): Used to compare columns of different lengths: H= L / N L = column length, N = number of plates H is a measure of plate size, the smaller (lower H) the better (HPLC ~ 10mm) Effective plate height: takes account of columns with different dead spaces Heff = L / Neff Reduced plate height: allows comparison of columns with different particle sizes h = H / dp where dP is the particle diameter (same units as L); (Good HPLC column: h = 3)
Performance parameters (Advanced) Capacity Factor (k) The ratio of mass in the stationary phase (mS) to that in the mobile phase (mM) where total mass: mT = mM + mS Capacity Factor: k = mS / mM = K. (VS / VM) where K is the equilibrium constant, VS is the volume of the stationary phase, and VM is the volume of the mobile phase (dead volume). Determining k Assume VR : VM = mT : mM Then: VR / VM = mT / mM = (mM + mS) / mM = 1 + k So: VR = VM (1 + k) And: tR = tM (1 + k) Since tM = t0k = (tR - t0) / t0 K should be between 1 and 5
Performance parameters (Advanced) Selectivity (α) and Resolution (Rs) Selectivity Factor (α):Comparison of interaction with stationary phase Ratio of capacity factors α = k (B) / k (A) • Primarily affected by changing the stationary or mobile phases • Larger α means better separation (but little gain in resolution beyond α=3) Resolution (RS):A measure of how well separated two peaks are: RS = 2(tR peak A - tR peak B) / (wA + wB) Since measuring w is difficult, can use: RS = 0.25 x [(α - 1) / α] x [ k(B) / (1 + k(B)) x N where B is the last eluting peak, and N is the plate number for B High Rs is better: should be at least 1.5 for baseline separation
Performance parameters (Optimisation) Optimisation depends on type of chromatography, usually involves changes in: • Stationary Phase: Hundreds of kinds on offer, choice based on analytes to be separated, cost Differences based on chemical structure, particle size, column bore and length, compressibility of packing • Mobile Phase:Use changes in polarity, pH, viscosity • Detector:Use best sensitivity available for analytes • Flow rate:affects retention time and diffusion and thus performance • Amount of sample:Too much will overload the column, too little will be difficult to detect accurately • Sample Matrix: Avoid incompatible contaminants, use minimum injection volume, preferable similar to the mobile phase (HPLC) • Temperature: increases improve performance (must avoid decomposition of sample) by increasing solubility and reducing viscosity. Very important in GC.
Performance parameters (Summary) Chromatographic systems must be optimised to give: • Good Peak Shape • Good separation/resolution (N, k, α, Rs) • Flat and horizontal baseline • No “artifactual” peaks • Shortest possible analysis times Resolution and Retention time are key