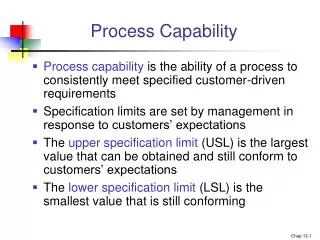
Process Capability
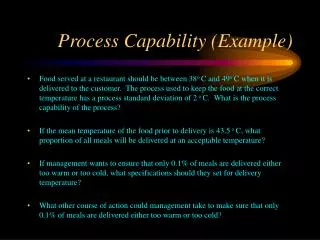
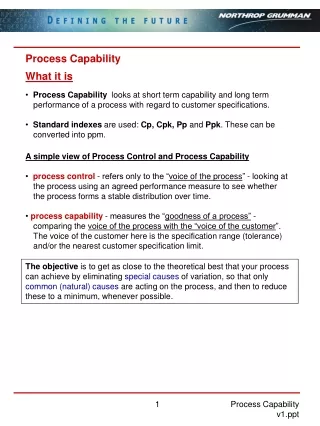
Process Capability. Chapter Six. Defining process capability. Process capability refers to the ability of the process to meet the specifications set by the customer or designer. Process capability analysis.

Process Capability
E N D
Presentation Transcript
Process Capability Chapter Six
Defining process capability • Process capability refers to the ability of the process to meet the specifications set by the customer or designer.
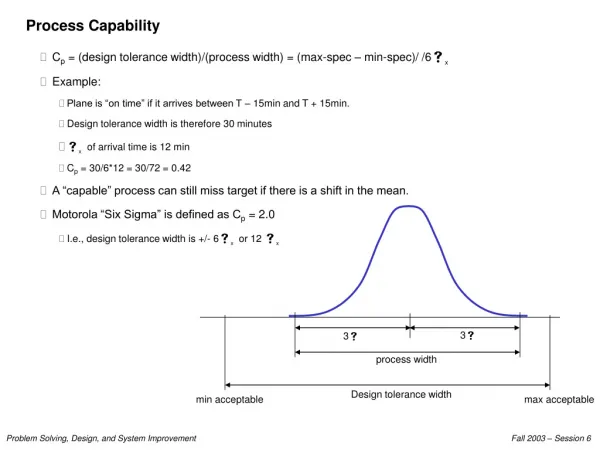
Process capability analysis • Objective is to determine how well the output from a process meets specification limits • Compare total process variation and tolerance. LSL USL -3 +3 Target
Individual values compared with averages • When distributions of averages are compared to distributions of individual values, the averages are grouped closer to the center value than are the individual values, as described by the central limit theorem.
Estimation of population sigma from sample data • The relationship between the standard deviation for individual values and the standard deviation for their averages is given by the formula: Where n = subgroup sample size
To simplify calculation • If the process can be assumed to be normal, the population standard deviation can be estimated from either the standard deviation associated with the sample standard deviation or the range: or
Control limits and specification limits • Xbar charts do not reflect how widely the individual values composing the plotting averages spread. • The spread can only be seen by observing what is happening on the S or R chart.
Process capability • It is important to reduce the process natural tolerance limits (NT) so that they are included within specification limits (S). • Nevertheless, if NT<< S, then the process can be unnecessarily expensive. • NT limits should be centered with regards to specification limits. • If NT>S, than scraps will be inevitably produced.
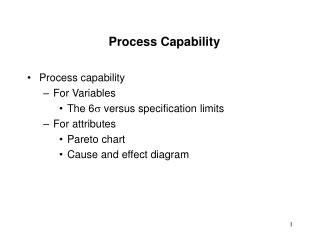
The Six sigma spread versus specification limits • Case I: 6 < USL - LSL • Most desirable; individual values fall within specification limits • Case II: 6 = USL - LSL • Okay, as long as the process remains in control • Case III: 6 > USL - LSL • Undesirable; process incapable of meeting specifications
Calculating process capability indices • Process capability indices: ratios that quantify the ability of a process to produce within specifications
Process capability ratios • Process Capability Ratios (PCRs) are a quantitative way to express process capability, that is the ability of the process to manufacture product that meets the specification. • This indicator is calculated using the very important assumption that the quality characteristic has a normal distribution (NT = 6·s).
Process capability ratios • In a practical application, the process standard deviation (s) is almost always unknown and must be replaced by an estimate (calculated when the PROCESS is IN CONTROL). • In general, we want Cp>1. Nevertheless, if Cp is too large, it means that NT<< S (the process can be unnecessarily expensive). • A typical reference value is Cp ≥ 4/3, that is to say Cp ≥ 1.33
Process capability ratios • The process capability ratio Cp does not take into account where the process mean is located related to the specifications. • Cp simply measure the spread of the specifications relative to the 6·s spread in the process. • Cp does not take process centering into account.
Process capability ratios • Here is a new PCR that takes process centering into account.
Process capability ratios For example the following distributions have Cp=2.
Process capability ratios • In general, if Cpl=Cpu, the process is centered at the midpoint of the specification, • If Cpk=Cp, the process is centered • If (NT) limits are within (S) limits, Cpk≥ 1. If the process average is beyond (S) limits, Cpk< 0.
Calculating process capability indices • See examples in the book