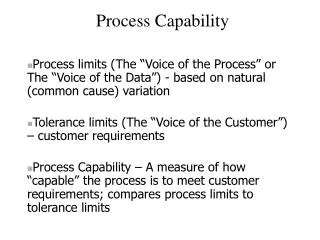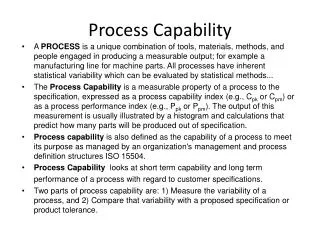
Process Capability
Process Capability. C p = (design tolerance width)/(process width) = (max-spec – min-spec)/ /6 x Example: Plane is “on time” if it arrives between T – 15min and T + 15min. Design tolerance width is therefore 30 minutes x of arrival time is 12 min C p = 30/6*12 = 30/72 = 0.42

Process Capability
E N D
Presentation Transcript
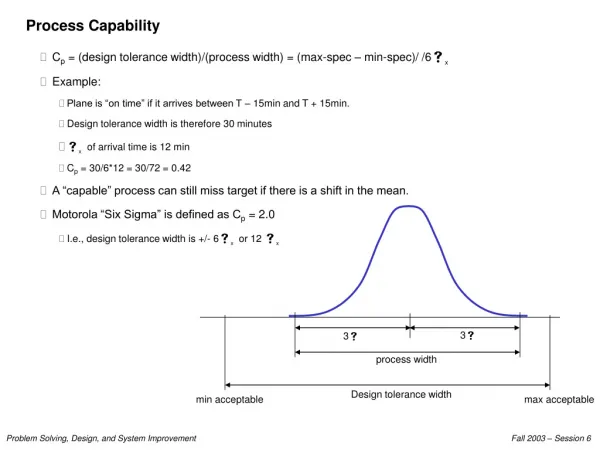
Process Capability • Cp = (design tolerance width)/(process width) = (max-spec – min-spec)/ /6x • Example: • Plane is “on time” if it arrives between T – 15min and T + 15min. • Design tolerance width is therefore 30 minutes • x of arrival time is 12 min • Cp = 30/6*12 = 30/72 = 0.42 • A “capable” process can still miss target if there is a shift in the mean. • Motorola “Six Sigma” is defined as Cp = 2.0 • I.e., design tolerance width is +/- 6x or 12 x 3 3 process width Design tolerance width min acceptable max acceptable Problem Solving, Design, and System Improvement
There are multiple solutions to most parametric design problems Analytical Expression for Brownie Mix “Chewiness” Chewiness = FactorA + FactorB Where FactorA = 600(1-exp(-7T/600)) + T/10 And FactorB = 10*Time HYPOTHETICAL FactorA FactorB Temperature Time 200F 400F 26 min 20 min Option 1 Option 2 Options 1 and 2 deliver the same value of “chewiness.” Why might you prefer one option over the other? Problem Solving, Design, and System Improvement
Parametric Tuning • Existing system that basically works. • Adjustments involve setting values of parameters. • In ideal case, have a nice analytical model and can optimize mathematically. This is rare in practice. • Examples: • Physical Processes • Almost any continuous manufacturing process, e.g. chemical processing, food processing • Products • Windshield wiper spray parameters • Catapult settings • Engine control settings • Services • Direct mail parameters (drop locations, mailing dates, placement of graphics) • Boarding process at airline gate • Call center procedures • Automated check-in process at hotel • Ad placement on Yahoo Problem Solving, Design, and System Improvement
Taguchi Methods • Any deviation from the target value is “quality lost.” • Use of statistical experimentation to find robust combinations of parameters. • Field is called “Design of Experiments” or “DOE.” • Systematically explore space of possible parameter values. • Based on analysis of relative influence of parameters on mean and variance of performance variable, select “robust design.” • A robust design is relatively insensitive to random variability in internal and external variables. Quality Quality Loss Loss = C(x-T)2 Good Performance Metric Performance Metric, x Bad Maximum acceptable value Minimum acceptable value Target value Target value Problem Solving, Design, and System Improvement
Methodology for Achieving Robust Design • Identify key variables and metrics • Articulation of performance metrics, goals • Causal diagram • Hypothesized sources of variability • Analytical models where available • Conduct exploratory experiments • Reduce variability • Design changes • Instructions/aids for user • Use logic, analysis, and rough experiments to focus further experimentation • Avoid wasting experiments on clearly infeasible regions of design space. • Perform focused experimentation within narrow ranges of variables • Use “Design of Experiments” techniques if combinatorically intractable • See Ulrich and Eppinger “Robust Design” chapter for details. • “Control” variability in laboratory setting • Focus on identifying combination of settings that minimize variability in performance. • Select final values for design variables. Problem Solving, Design, and System Improvement
Take Aways • Products and processes are causal systems • Typically have lots of variables • Internal variables are set by the manufacturer/provider • Target settings and associated variance • External variables are set by the environment or the user • Target settings and associated variance (variance often much harder to control than with internal variables) • Impossible to eliminate all variability • GOAL: find target settings for variables such that variability in other values of these variables has minimal effect on output/performance….a “robust design.” • Methodology for achieving robust design • Causal model, even if not explicitly analytical • Early exploratory experimentation • Control of variability and increased robustness through design changes • Focused experimentation to refine settings Problem Solving, Design, and System Improvement