Process Capability
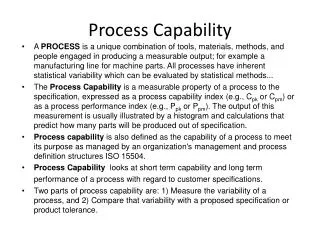
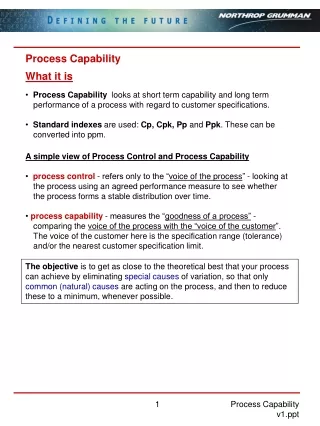
Process Capability. What it is. Process Capability looks at short term capability and long term performance of a process with regard to customer specifications. Standard indexes are used: Cp, Cpk, Pp and Ppk . These can be converted into ppm.

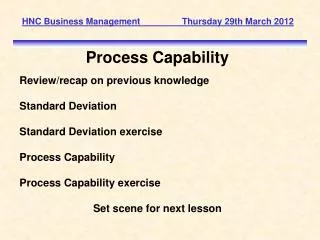
Process Capability
E N D
Presentation Transcript
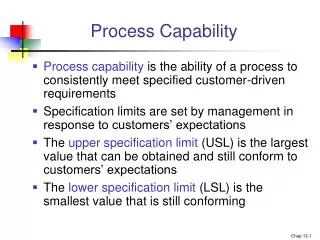
Process Capability What it is • Process Capability looks at short term capability and long term performance of a process with regard to customer specifications. • Standard indexes are used: Cp, Cpk, Pp and Ppk. These can be converted into ppm. • A simple view of Process Control and Process Capability • process control - refers only to the “voice of the process” - looking at the process using an agreed performance measure to see whether the process forms a stable distribution over time. • process capability - measures the “goodness of a process” - comparing the voice of the process with the “voice of the customer”. The voice of the customer here is the specification range (tolerance) and/or the nearest customer specification limit. The objective is to get as close to the theoretical best that your process can achieve by eliminating special causes of variation, so that only common (natural) causes are acting on the process, and then to reduce these to a minimum, whenever possible. Process Capability v1.ppt
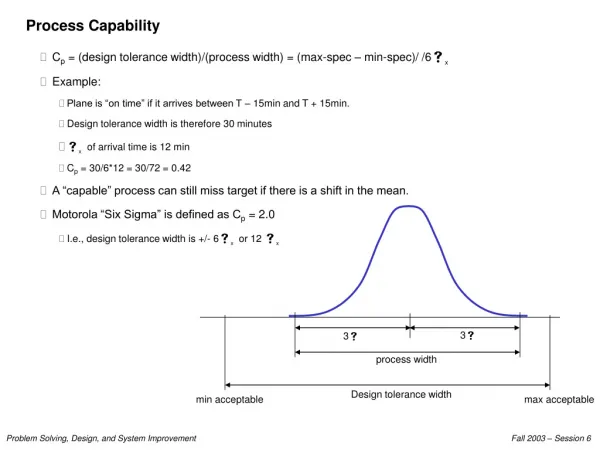
Process Capability What it is Process Control Note - no reference to specs ! In Control (Special Causes Eliminated) TIME (continued below) Out of Control (Special Causes Present) Process Capability In Control and Capable (Variation from Common Causes Reduced) Lower Spec Limit Upper Spec Limit TIME (continued from above) In Control but not Capable (Variation from Common Causes Excessive) Process Capability v1.ppt
Process Capability What it is Cp or ENTITLEMENT is the theoretical best hat a process can achieve. Process Capability v1.ppt
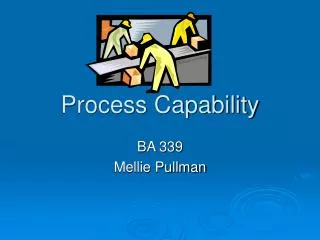
Process Capability What it is The 4 capability Capability Indexes: explaining the terms . . . Not (necessarily) in Control: common causes and special causes acting (possible drifts or shifts in the process) long term short term In Control: only common causes acting (no sudden drifts or shifts in the process) Process Capability v1.ppt
Pooled or total standard deviation - used in manual calculations: Pooled (or combined): sP = sqrt [ sum (d.f. *s2) / sum (d.f.) ] Total (or overall): sT = sqrt [ sum (x - x) 2 / (n-1) ] Process Capability What it is The 4 capability Capability Indexes: explaining the terms . . . Process Capability v1.ppt
Cp = USL-LSL 6sP Pp = USL-LSL 6sT Process Capability What it is The 4 capability Capability Indexes: explaining the terms . . . LSL USL Cp, Pp compares specification range (tolerance)to process width regardless of where the process is centred. It is the ratio of the specification width to 6 x process standard deviation. sP =pooled standard deviation sT =total standard deviation Process Capability v1.ppt
X Cpkl = X-LSL 3sP Cpku = USL-X 3sP Ppkl = X-LSL 3sT Ppku = USL-X 3sT LSL USL Cpk = min {Cpkl, Cpku} Ppk = min {Ppkl, Ppku} Process Capability What it is The 4 capability Capability Indexes: explaining the terms . . . Cpk, Ppk measure how close the process centre is to the nearest customer spec. It is (difference between the process average and the nearest specification) (3 x the process standard deviation). Process Capability v1.ppt
Process Capability How to use it • Use Minitab output whenever possible, since it combines the indexes with a graphical representation of the process: actual sample, estimated short term capability and estimated long term performance • Also use as a rule of thumb the following chart (Cpk x 3) +1.5 = sigma Caution: Cpk is an index much misused: It is only applicable to normally distributed variable data that is measured in the short term. Conversions from Cpk to ppm and sigma assume that all defectives are occurring at one tail of the distribution with an average sigma shift of 1.5 sigma. (industry standard). Cpk MUST be seen as part of a package of information. Capability studies for non-normal data (Weibull) do not give Cpk values Process Capability v1.ppt
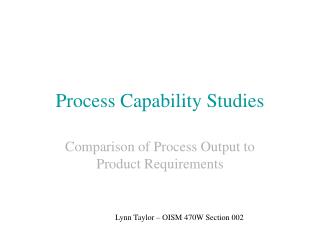
Process Capability Example Using Minitab: Process Capability v1.ppt
Process Capability Example Using Minitab, with non-normal data Note: For Weibull Capability Analysis, data must have positive values, and LONG TERM metrics only are given. NO values for Cpk are given, because the data is non-normal Process Capability v1.ppt
Process Capability How it helps • A Process Capability study is the end result of the analysis done on process output data. • A Process Capability study reflects what our customer sees. • It indicates what our short term and long term situation looks like. • Recognise however that our processes need to be stable (in statistical control) as well as capable. • Before anything, we must have faith in our measurements, hence the need for a measurement system analysis. References • ASG aTQ training modules: • 3.3, 3.4, 3.5 : (MSA) Measurement System Analysis • 4.1, 4.2, 4.3, 4.5 : Process Capability • 8.4, 8.5, 8.6, 8.7 : SPC (and non-SPC control) • ASG “seniors” aTQ training module 1.5 : Capability Process Capability v1.ppt