Download

1 / 24
240 likes | 257 Views
In this model we study the dynamics and control of hepatitis B virus HBV infection which is a major health problem worldwide by considering condom, vaccination and treatment as control measures. Initially we determined the basic reproduction number R 0 for the model and observe that once R 0 1, the disease free equilibrium will be stable and HBV infection can be controlled using the three control measures and we also study the solution of the endemic equilibrium point of the model. Next we take the sensitivity analysis of the basic reproduction number of HBV infection and obtain that the endemicity of the infection will reduce with the controls. Finally, the numerical simulation result shows that combination of condom, vaccination and treatment is the most effective way to control hepatitis B infection. Titus Ifeanyi Chinebu | Edmund Onwubiko Ezennorom | Godwin C. E. Mbah "A Mathematical Model of the Dynamics of Hepatitis B Virus (HBV) Infection with Controls" Published in International Journal of Trend in Scientific Research and Development (ijtsrd), ISSN: 2456-6470, Volume-2 | Issue-5 , August 2018, URL: https://www.ijtsrd.com/papers/ijtsrd18164.pdf Paper URL: http://www.ijtsrd.com/mathemetics/other/18164/a-mathematical-model-of-the-dynamics-of-hepatitis-b-virus-hbv-infection-with-controls/titus-ifeanyi-chinebu<br>

E N D
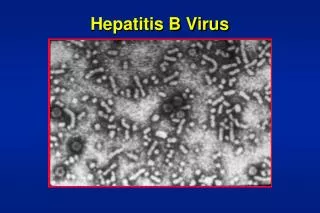
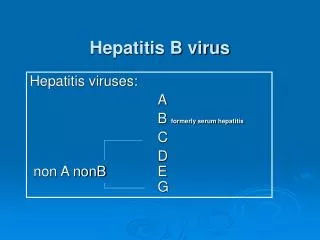
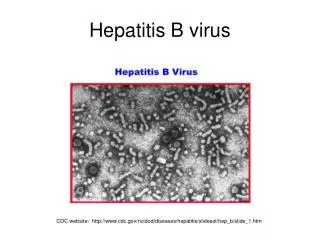
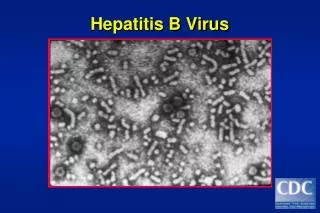
International Journal of Trend in Scientific Research and Development (IJTSRD) International Open Access Journal ISSN No: 2456 - 6470 | www.ijtsrd.com | Volume - 2 | Issue – 5 A Mathematical Model of the Dynamics of Hepatitis B Virus (HBV) Infection with Controls Titus Ifeanyi Chinebu1, Edmund Onwubiko Ezennorom2, Godwin C. E. Mbah3 1,2Department of Computer Science, Madonna University Nigeria, Elele,Nigeria 3Department of Mathematics, University of Nigeria, Nsukka,Nigeria ABSTRACT In this model we study the dynamics and control of hepatitis B virus (HBV) infection which is a major health problem worldwide by considering condom, vaccination and treatment as control measures. Initially we determined the basic reproduction number R_0 for the model and observe that once R_0<1, the disease free equilibrium will be stable and HBV infection can be controlled using the three control measures and we also study the solution of the endemic equilibrium point of the model. Next we take the sensitivity analysis of the basic reproduction number of HBV infection and obtain that the endemicity of the infection will reduce with the controls. Finally, the numerical simulation result shows that combination of condom, vaccination and treatment is the most effective way to control hepatitis B infection. Keywords: Mathematical model, HBV Infection, HBV Control, Condom, Vaccination, Treatment. I. INTRODUCTION Hepatitis B was called serum hepatitis in the past (Southern Nevada Health District (SNHD), 2015). This virus has a number of serological types and the infection occurs at any age but mostly in adults. The incubation period is 50 to 180 days. The virus enters the blood and is spread by blood and blood products. Antibodies are formed and immunity persists after recovery. Infection usually leads to severe illness lasting 2 to 3 weeks, often followed by a protracted convalescence. Carriers may or may not have had clinical disease. Type B virus (serum hepatitis) may cause massive liver necrosis and death and in less severe cases recovery may be complete (Corazon, 2015). In chronic hepatitis which may develop, live virus continue to circulate in the blood and other body fluids, that is, saliva, semen, vaginal secretions. The condition may predispose to liver cancer. Hepatitis is the inflammation of the liver caused by virus, toxic substances or immunological Infectious hepatitis is caused by viruses, several types of which have been isolated as specific causes of the disease and can be detected by tests. Associated with acute viral hepatitis is acute infection with hepatitis B virus and it starts with general ill – health such as mild fever, dark urine, nausea, loss of appetite, vomiting, body aches, and then progress to development of jaundice. The illness lasts for few weeks before gradually improves in most effected people. Few patients may die as a result of fulminant hepatic failure and in some individuals, the infection may go unrecognized (asymptomatic) (Pan and Zeng, 2005). Chronic HBV may be either asymptomatic or associated with a chronic inflammation of the liver, leading to cirrhosis over a period of several years. Incidence of hepatocellular carcinoma (liver cancer) increases in chronic HBV patients. Avoidance of alcohol consumption is recommended to chronic carriers of HBV infection because it increases their risk for cirrhosis and liver cancer. Hepatitis B virus has been linked to the development of membranous glomerulonephritis (MGN) (Chang, 2007). II. Related Literature Hepatitis B virus infection can be controlled either through prevention or treatment. The most effective way of preventing HBV infection is by immunization with hepatitis B vaccine. Prevention of HBV abnormalities. @ IJTSRD | Available Online @ www.ijtsrd.com | Volume – 2 | Issue – 5 | Jul-Aug 2018 Page: 1654
International Journal of Trend in Scientific Research and Development (IJTSRD) ISSN: 2456-6470 transmission during early childhood is important because of the high likelihood of chronic infection and chronic liver diseases that occur when children less than five years of age become infected. In HBV infection, the development of anti – HBs as HBsAg disappears suggests that anti – HBs are the protective antibody. Therefore, immunoprophylaxis of HBV requires the administration of anti – HBs antibodies by vaccination with HBsAg. The vaccine schedule most often used for adult and children has been three dose intra muscular injections in which the second and third doses are administered 1 and 6 months after the first. Recombivax HB has been approved for aged 11 – 15 years. In 2007, Twinrix was approved as a four dose accelerated schedule by Food and Drug Administration (FDA) and the schedule of doses are 0, 7, and 21 – 31 days and a booster dose at 12 months after the initial doses. If the interval between doses is longer than the recommended interval, it is not necessary to restart the series or add doses (Center for Disease Control and Prevention (CDC), 2012). This vaccine is for persons at the age of 18 years and above. Also, there is vaccine for infants born to HBsAg negative mothers (coffin et al, 2011). The first dose can be administered before the newborn is discharged from the hospital. The second dose can be given after 1 to 2 months and the third dose can be given 6 to 18 months later. One cannot be infected with hepatitis B from these vaccines (Chu and Liaw, 2007). Following vaccination, hepatitis B surface antigen may be detected in serum for several days; this is known as vaccine antigenaemia (Arauz-Ruiz et al, 2002). Protection has be observed to last 12 years in individuals who show adequate initial response to the primary course of vaccinations, and that immunity is predicted to last at least 25 years (Glebe and Urban, 2007). HBV infection can also be prevented through the use of condom or another type of latex barrier while having sex because it have been shown that consistent and correct use of condom is 98 – 99% effective in preventing HBV transmission. Since HBV infection is transmitted through body fluids; prevention is thus the avoidance of such transmission like unprotected sexual contact (use of condom), blood transfusion, reuse of contaminated needles and syringes, and vertical transmission during birth. Acute hepatitis B infection does not usually require treatment because about 95% of most adults clear the infection spontaneously (Shapiro, 1993, Lok et al, 2015). Early antiviral treatment may only be required in fewer than one percent of patients, whose infection are of great severity (fulminant hepatitis) immunocompromised. In patients with fulminant infection, intravenous (IV) feeding may be needed, if the patient has persistent vomiting and can’t take oral foods. Ninety percent of patients with acute HBV infection have a favorable course and recover completely (Jayapal, 2007). On the other hand, treatment of chronic HBV infection may be necessary to reduce the risk of cirrhosis and liver cancer. Chronically infected individuals with persistently elevated serum alamine aminotranferase, a marker of liver damage and HBV DNA level are candidates for therapy (Shi et al, 2011). Thirty to forty percent of patients with chronic hepatitis B respond to ???? treatment. Immune defense is partially active in chronic hepatitis B patients, since the viral load and HBsAg level are lower (Kosinska et al 2013). Undertaken in various experimental systems is antigen expressing DNA in combination with antiviral therapy or immunotherapy with various HBV derived antigens and example is the work of Michael Roggendorf in infected woodchuck with partial success (Kosinska et al 2013). Hepadnaviral cccNDA silencing or destruction would be the best therapy for control of HBV infection but it is still a science fiction (Gerlich, 2013). The current therapy (GS – 9620) for HBV infection suppresses viral replication and delay progression of liver damage. This GS – 9620 which works by targeting the virus represents the first conceptually new treatment for hepatitis B virus in more than a decade (Texas Biomedical Research Institute, 2013). Other antiviral medicine includes, Lemivudine (Epivir) and the newer neucleotide analogues famciclovir, lobucavir and adefovir (Hepsera), dipivoxil, tenofovir (viread), tesbivudine (Tyzeka), entecavir (Baraclute) (Lok et al, 2015) and they directly block or suppress or destroy the HBV by interfering with its replication (Gerlich, 2013; WHO, 2015). These agents are highly effective and well tolerated. ???? and lamivudine have been approved by FDA for the treating chronic hepatitis B. For decompensated liver disease, liver transplant may be required, i.e., surgery may be required to treat hepatocellular carcinoma (Bonino, 1987and Jayapal, 2007). However some individuals are much more likely to respond than others and this might be because of the genotype of the infection virus or the patient’s heredity. The treatment reduces viral replication in the liver, thereby reducing the viral load (the amount of virus pareticles as measured in the or who are @ IJTSRD | Available Online @ www.ijtsrd.com | Volume – 2 | Issue – 5 | Jul-Aug 2018 Page: 1655
International Journal of Trend in Scientific Research and Development (IJTSRD) ISSN: 2456-6470 blood)(Lok and Mcmahon, 2007). Response to treatment differs between genotypes. Interferon treatment may produce an e antigen seroconversion rate of 37% in genotype A but only a 6% seroconversion rate in type D. Genotype B has similar seroconversion rates to type A (Zoulim, 2004). Garib – Zahidi (2012), used the model presented by Nowak et al (1996) to study the kinetics of HBV infection (cellular automation). They showed that cellular automation is sophisticated enough to reproduce the basic dynamical features of the infection. They acknowledged that the basic dynamical features of the infection are the biphasic behavior of viral load and age of various patients. Kamyad et al, (2014) constructed a model with two controls (vaccination and treatment) based on the characteristics of HBV transmission. They observed from the numerical results that mixed control measures responds better than any other independent control. Abdulrahman et al, (2013) in a model of HBV transmission dynamics in a population with viral dynamics, incorporating vertical transmission and sexual maturity showed that all the parameters in their model are sensitive to the transmission and prevalence of HBV either positively or negatively and that the most influential of the parameters are the natural death rate (?), birth rate (?), HBV – sexual transmission probability contact rate (?), and the total sexual contact rate (?), with the last two parameters having +1 sensitivity index.In the analysis of the transmission dynamics and control of hepatitis B virus (HBV) infection in Nigeria using six different control strategies with a 25years waning rate of vaccine, it was observed that the present stratege of HBV infection control can never bring about disease control in Nigeria (Abdulrahman et al, 2013). They also stated that effort should be made so that 20% to 30% of sexually active susceptible Nigerians will be vaccinated yearly, to be added to the 66% who are vaccinated yearly at birth. Momoh et al (2012) confirmed that much progress have been made in understanding the transmission dynamics of HBV infection but maintained that more effort is needed if we want to conquer the infection. Obaid and Elaiw (2014) proposed and analyzed two virus infection models with antibody immune response and chronically infected cells. It is not reachable in practice to vaccinate newborns by a rate greater than 96%. Therefore, treatment or additional vaccination strategies are needed to control the spread of HBV infection in population (Moneim and Khalil, 2015). Certainly, controlling HBV infection simply indicates reducing the susceptible by vaccination or reducing the latent and infected by treatment scheme Kimbir et al (2014), extended the model of Zou et al (2009) and used it to study the transmission dynamics of HBV infection considering vaccination and treatment as control measure in the host population. They showed from the numerical simulation of their model that effective vaccination and treatment is a good control strategy for HBV infection. But a combination of vaccination and treatment is a better control strategy for the disease. In the recovery of HBV infection, each component of innate and adaptive immune response contributes, but in the absence of one component of innate immunity, the remaining two defense mechanisms are sufficient for viral clearance (Dontwi et al, 2010). III. MODEL FORMULATION 3.1: THE ASSUMPTIONS OF THE MODEL: 1.We assume that both Susceptible, Exposed (infected), infectious and Recovered individuals die at the same natural rate ?. 2.The treated individuals recover, unless the individual dies naturally (Ahmed et al, 1987 and Oleary et al, 2008). 3.Also, we assume that vaccinated individuals do not acquire permanent immunity because the efficacy of the vaccine wanes (Keeling and Rohani 2008). 4.Exposed (infected) individual can spontaneously recover from the infection 5.Infectious but not treated individuals can recover by the effect of the natural immune response (noncytocidal responses) (Zou et al, 2010; Kar and Jana 2013). 6.Once an individual progresses to infectious class, he is classified as infectious but treated or infectious but not treated. 3.2: MODEL VARIABLES FOR CONTROL OF HEPATITIS B VIRUS INFECTION The equations are partitioned compartments of: ?(?) Susceptible individual; ??(?) Susceptible but vaccinated; ??(?) Susceptible but not vaccinated; ???(?) Susceptible, vaccinated and uses condom; into twelve @ IJTSRD | Available Online @ www.ijtsrd.com | Volume – 2 | Issue – 5 | Jul-Aug 2018 Page: 1656
International Journal of Trend in Scientific Research and Development (IJTSRD) ISSN: 2456-6470 ???(?) Susceptible, not vaccinated but uses condom; Susceptible, vaccinated but does not use condom; ????(?) Susceptible, not vaccinated and does not use condom; ?(?) Exposed (infected); ??(?) Exposed (infected) and treated; ??(?) Infectious and treated; ???(?) Infectious and not treated; ?(?) Recovered. 3.3: MODEL FORMULATION FOR HBV CONTROL The model for control of HBV in human population were formulated using ? as the recruitment level of the population at time ?. This model incorporated vaccination given to susceptible individuals, condom use by vaccinated and non vaccinated individuals and treatment given to exposed (infected) and infectious individuals. In the model, we made use of the following variables and parameters. 3.4: MODEL PARAMETER CONTROL ?1 Recruitment individuals; ?1 Rate at which susceptible individuals are vaccinated; ?(1 − ?1) Rate at which susceptible individuals are not vaccinated; ?1 Rate at which vaccinated susceptible individuals use condom; ?5(1 − ?1) Rate at which vaccinated susceptible individuals does not use condom; ? Denote the rate of condom usage by non- vaccinated individuals; ?(1 − ?) Denote the rate at which susceptible individuals who are not vaccinated do not use condom; ∅1?1 The rate at which susceptible individuals who are vaccinated but does not use condom are being exposed to the infection due to waning of the vaccine; ?(1 − ?) The rate at which non-vaccinated susceptible individuals who use condom are being exposed to the infection due to error in condom/condom usage; ? Denote the rate constant at which susceptible individuals who are not vaccinated and does not use condom move to exposed class ?1 The rate of exposed (infected) individuals who obtain treatment; ?2 The rate of exposed (infected) individuals who had spontaneous recovery; 1 − ?1 The rate at which exposed individuals do not obtain treatment and moves to infectious class; ? The rate at which infectious individuals are treated; ?4(1 − ?) The rate at which infectious individuals are not treated; ?1 The rate at which treated infectious individuals move to recovered class; ? Rate at which non treated infectious individuals move to recovered class; ? Death rate of non treated infectious individuals due to the infection; ?1 The rate at which treated exposed individuals move to susceptible class; ?1 The rate at which recovered individuals move to susceptible class; ?1 The movement rate of vaccinated susceptible individuals who use condom, to the susceptible class; ?1 The natural death rate of both the susceptible class, exposed (infected) class, infectious class and Recovered class. ????(?) FOR HBV level of susceptible Fig 1: Flow diagram of Hepatitis B Virus Control Model @ IJTSRD | Available Online @ www.ijtsrd.com | Volume – 2 | Issue – 5 | Jul-Aug 2018 Page: 1657
International Journal of Trend in Scientific Research and Development (IJTSRD) ISSN: 2456-647 From the diagram above we obtain the following equations; ?? ??= ?1− ?1? − ?(1 − ?1)? − ?1? + ?1???+ ?1??+ ?1? ??? ??= ?1? − ?1??− ?1??− ?5(1 − ?1)?? ??? ?? ???? ?? ???? ?? ????? ?? ????? ?? ?? ??= ?1?1????+ ?(1 − ?)???+ ?????− (1 − ?1)? − ?1? − ?2? − ?1? ??? ?? ??? ??= ?(1 − ?1)??− ?1??− ?1?? ???? ?? ?? ??= ?1??+ ????+ ?2? − ?1? − ?1? } 3.5: ANALYSIS OF THE SYSTEM FOR CONTROL If we assume that the control ?1(?),?1(?),?(?),?1(?),??? ?(?) are functions, we analyze the equilibrium point and the basic reproduction number of the system. 3.6: EQUILIBRIUM POINT AND BASIC REPRODUCTION NUMBER We shall discuss the two possible non negative equilibrium of system (3.1) and these are the disease = ?(1 − ?1)? − ?1??− ???− ?(1 − ?)?? = ?1??− ?1???− ?1??? = ???− ?1???− ?(1 − ?)??? = ?5(1 − ?1)??− ?1????− ?1?1???? (3.1) = ?(1 − ?)??− ?1????− ????? = ?1? − ?1??− ?1?? = ?4(1 − ?)(1 − ?1)???− ????− ?1???− ???? free equilibrium point and the endemic equilibrium point 3.7: DISEASE FREE EQUILIBRIUM The disease free equilibrium state denotes absence of infection, vaccination, use of condom and treatment. Therefore, all the infected class will be zero and the entire population will comprise of Susceptible, Vaccinated, Non vaccinated, Condom compliance and Non condom compliance individuals. At equilibrium state, we set the rate of change of each variable to be equal to zero. parameters constant Thus ?? ??= Als0 let, (?,??,??,???,???,????,????,?,??,??,???,?) = (?∗, ?? equilibrium state. ??? ??= ??? ??= ???? ??= ???? ??= ????? ?? ????? ?? ?? ??= ??? ??= ??? ??= ???? ??= ?? ??= 0 (3.2) = = ,∗,???? ∗, ??? ∗, ?∗) at ∗, ?? ∗, ??? ∗,??? ∗ ∗ , ?∗,?? ,???? @ IJTSRD | Available Online @ www.ijtsrd.com | Volume – 2 | Issue – 5 | Jul-Aug 2018 Page: 1658
International Journal of Trend in Scientific Research and Development (IJTSRD) ISSN: 2456-6470 Therefore, 0 = ?1− ?1? − ?(1 − ?1)? − ?1? + ?1???+ ?1??+ ?1? 0 = ?1? − ?1??− ?1??− ?5(1 − ?1)?? 0 = ?(1 − ?1)? − ?1??− ???− ?(1 − ?)?? 0 = ?1??− ?1???− ?1??? 0 = ???− ?1???− ?(1 − ?)??? 0 = ?5(1 − ?1)??− ?1????− ?1?1???? 0 = ?(1 − ?)??− ?1????− ????? 0 = ?1?1????+ ?(1 − ?)???+ ?????− (1 − ?1)? − ?1? − ?2? − ?1? 0 = ?1? − ?1??− ?1?? 0 = ?(1 − ?1)??− ?1??− ?1?? 0 = ?4(1 − ?)(1 − ?1)???− ????− ?1???− ???? 0 = ?1??+ ????+ ?2? − ?1? − ?1? } (3.3) Let ?5= ?(1 − ?1),?6= ?5(1 − ?1),?7= ?(1 − ?),?8= ?(1 − ?),?9= ?(1 − ?1), ?10= ?4(1 − ?). If we label the equations in (3.3) as (i) to (xii) and substitute ?∗= ?? (3.3), we have from (3.3xii) that ?1??+ ????− ?1? − ?1? = 0 (?1+ ?1)? = 0 ∴ ? = 0 (3.4) From (3.3iv), we have ?1??− ????− ?1???= 0 ∗= ?? ∗= ??? ∗= 0 into ?1?? ?1+ ?1 (3.5) ∴ ???= From (3.3ii) we obtain ?1? ?1+ ?1+ ?6 (3.6) ??= Substituting (3.4), (3.5) and (3.6) into (3.3i) we get ?1 ?1? ?1+ ?1+ ?6) + 0 + 0 = 0 ?1− ?1? − ?(1 − ?1)? − ?1? + ?1( ?1+ ?1)( ?1(?1+ ?1)(?1+ ?1+ ?6) (?1+ ?1+ ?5)(?1+ ?1)(?1+ ?1+ ?6) − ?1?1?1 (3.7) ∴ ? = From (3.6) we have that ?1? ?1+ ?1+ ?6 ??= If we substitute (3.7) into (3.6) we obtain ?1?1(?1+ ?1) (?1+ ?1+ ?5)(?1+ ?1)(?1+ ?1+ ?6) − ?1?1?1 (3.8) ??= From (3.3iii) we have that ?(1 − ?1)? − ?1??− ???− ?(1 − ?)??= 0 (?1+ ? + ?8)??= ?5? ?5? ?1+ ? + ?8 (3.9) ??= @ IJTSRD | Available Online @ www.ijtsrd.com | Volume – 2 | Issue – 5 | Jul-Aug 2018 Page: 1659
International Journal of Trend in Scientific Research and Development (IJTSRD) ISSN: 2456-6470 Substituting (3.7) into (3.9) gives us ?1(?1+ ?1)(?1+ ?1+ ?6) (?1+ ?1+ ?5)(?1+ ?1)(?1+ ?1+ ?6) − ?1?1?1) (3.10) ?5 ??= ?1+ ? + ?8( Remember that (3.5) is ?1?? ?1+ ?1 ???= Therefore, if we substitute (3.8) in (3.5) we obtain ?(? + ?1)(? + ?1+ ?3) (?1+ ?1+ ?5)(?1+ ?1)(?1+ ?1+ ?6) − ?1??1) ?1?1?1 (?1+ ?1+ ?5)(?1+ ?1)(?1+ ?1+ ?6) − ?1??1 (3.11) ?1?1 ???= ( (?1+ ?1)(?1+ ?1+ ?6))( ???= From (3.3v) we have that ???− ?1???− ?(1 − ?)???= 0 ??? ?1+ ?7 (3.12) ???= Then, substituting (3.10) into (3.12) we get ?1(?1+ ?1)(?1+ ?1+ ?6) (?1+ ?1+ ?5)(?1+ ?1)(?1+ ?1+ ?6) − ?1?1?1) (3.13) ??5 ???= ( (?1+ ?7)(?1+ ? + ?8))( Notice that (3.3vi) is ?5(1 − ?1)??− ?1????− ?1?1????= 0 (?1+ ?1?1)????= ?6?? ?6?? ?1+ ?1?1 (3.14) ????= We then substitute (3.8) into (3.14) to obtain ?1(?1+ ?1)(?1+ ?1+ ?6) (?1+ ?1+ ?5)(?1+ ?1)(?1+ ?1+ ?6) − ?1?1?1) ?1(?1+ ?1) (?1+ ?1+ ?5)(?1+ ?1)(?1+ ?1+ ?6) − ?1?1?1) (3.15) ?6 ?1 ????= ( ?1+ ?1?1)( ?6?1 ?1+ ?1?1)( ?1+ ?1+ ?6)( ????= ( Also, we have that (3.3vii) is ?(1 − ?)??− ?1????− ?????= 0 (?1+ ?)????= ?8?? ?8?? ?1+ ? (3.16) ????= If (3.10) is substituted into (3.16), we obtain ?8 ?1+ ?( Let ?0 ?1(?1+ ?1)(?1+ ?1+ ?6) (?1+ ?1+ ?5)(?1+ ?1)(?1+ ?1+ ?6) − ?1?1?1) (3.17) ?5 ????= ?1+ ? + ?8)( ∗ be the disease free equilibrium point, then, ∗= [?,??,??,???,???,????,????,0,0,0,0] ?0 @ IJTSRD | Available Online @ www.ijtsrd.com | Volume – 2 | Issue – 5 | Jul-Aug 2018 Page: 1660
International Journal of Trend in Scientific Research and Development (IJTSRD) ISSN: 2456-6470 Using (4.60) and substituting the value of ?6 ??? ?5we have ?1(?1+ ?1)(?1+ ?1+ ?6) (?1+ ?1+ ?5)(?1+ ?1)(?1+ ?1+ ?6) − ?1?1?1 ?1(?1+ ?1)(?1+ ?5) (?1+ ?)(?1+ ?1)(?1+ ?5) − 0= ?1?1(?1+ ?1) (?1+ ?1+ ?5)(?1+ ?1)(?1+ ?1+ ?6) − ?1?1?1 (0)?1(?1+ ?1) (?1+ ?)(?1+ ?1)(?1+ ?5) − 0= 0 ?5 ?1+ ? + ?8( ? ?1+ ?( ?0= ?1 ?1+ ? = ??0= = ?1(?1+ ?1)(?1+ ?1+ ?6) (?1+ ?1+ ?5)(? + ?1)(? + ?1+ ?6) − ?1?1?1) ?1(?1+ ?1)(?1+ ?5) (?1+ ?)(?1+ ?1)(? + ?5) − 0) = ??0= ??1 (?1+ ?)(?1+ ?) = ?1?1?1 (?1+ ?1+ ?5)(?1+ ?1)(?1+ ?1+ ?6) − ?1?1?1 ?1(0)(0) (?1+ ?)(?1+ ?1)(?1+ ?2) − 0= 0 ???0= = ?1(?1+ ?1)(?1+ ?1+ ?6) (?1+ ?1+ ?5)(? + ?1)(? + ?1+ ?6) − ?1?1?1) ?1(?1+ ?1)(?1+ ?5) (?1+ ?)(?1+ ?1)(?1+ ?5) − 0) = 0 ?1(?1+ ?1) (?1+ ?1+ ?2)(? + ?1)(? + ?1+ ?3) − ?1?1?1) ?(? + ?1) (?1+ ?)(?1+ ?1)(?1+ ?5) − 0) = 0 ?1(?1+ ?1)(?1+ ?1+ ?6) (?1+ ?1+ ?5)(? + ?1)(? + ?1+ ?6) − ?1?1?1) (?1+ ?1)(?1+ ?5) (?1+ ?)(?1+ ?1)(?1+ ?5) − 0) = ??5 ???0= ( (?1+ ?7)(?1+ ? + ?8))( (0)? (?1+ ?4)(?1+ ?))( ?3?1 ?1+ ?1?1)( ?5(0) ?1+ ?1?1)( ?8 ?1+ ?( ? ?1( = ( ????0= ( = ( ?5 ????0= ?1+ ? + ?8)( ? ???1 ?1(?1+ ?)(?1+ ?) = ?1+ ?)( The disease free equilibrium point of the model ?0 [ ?1+?,0, 3.8: STABILITY OF THE DISEASE FREE EQUILIBRIUM (DFE) In equation (3.1), all the parameters are non negative and we assume stable population with per capita recruitment of susceptible individuals and death rate (both natural and disease induced). For simplicity, the population size is normalized to one, that is ?,??,??,???,???, ????,????,?,??,??,???,? are respectively the fraction of the susceptible, susceptible with vaccination, susceptible without vaccination , susceptible with vaccination and uses condom, susceptible with vaccination but does not use condom, susceptible without vaccination but uses condom, susceptible without vaccination and does not use condom, exposed, exposed but treated, infectious but treated, infectious but not treated and recovered. This can be represented thus; ? + ??+ ??+ ???+ ???+ ????+ ????+ ? + ??+ ??+ ???+ ? = 1 (3.18) According to Pang, (2010) and Kamyard, (2014) equation (3.2) holds and we can omit the equation for R in our analysis so that (3.1) becomes ∗= [?,??,??,???,???,????,????,0,0,0,0] is ?1 ??1 ???1 ?1(?1+?)(?1+?),0,0,0,0]. (?1+?)(?1+?),0,0,0, @ IJTSRD | Available Online @ www.ijtsrd.com | Volume – 2 | Issue – 5 | Jul-Aug 2018 Page: 1661
International Journal of Trend in Scientific Research and Development (IJTSRD) ISSN: 2456-6470 ?? ??= ?1− ?1? − ?(1 − ?1)? − ?1? + ?1???+ ?1?? +?1[1 − (? + ??+ ??+ ???+ ???+ ????+ ????+ ? + ??+ ??+ ??? )] ??? ??= ?1? − ?1??− ?1??− ?5(1 − ?1)?? ??? ?? ???? ?? ???? ?? ????? ?? ????? ?? ?? ??= ?1?1????+ ?(1 − ?)???+ ?????− (1 − ?1)? − ?1? − ?2? − ?1? ??? ?? ??? ??= ?(1 − ?1)??− ?1??− ?1?? ???? ?? = ?(1 − ?1)? − ?1??− ???− ?(1 − ?)?? = ?1??− ?1???− ?1??? = ???− ?1???− ?(1 − ?)??? (3.19) = ?5(1 − ?1)??− ?1????− ?1?1???? = ?(1 − ?)??− ?1????− ????? = ?1? − ?1??− ?1?? = ?4(1 − ?)(1 − ?1)???− ????− ?1???− ???? } Let ?1(?) = ?(?) + ??(?) + ??(?) + ???(?) + ???(?) + ????(?) + ????(?) + ?(?) + ??(?) + ??(?) + ???(?) (3.20) Then, ?1(?) = ?1− ?1? − ?(1 − ?1)? − ?1? + ?1???+ ?1?? +?1[1 − (? + ??+ ??+ ???+ ???+ ????+ ????+ ? + ??+ ??+ ??? )] +?1? − ?1??− ?1??− ?5(1 − ?1)??+ ?(1 − ?1)? − ?1??− ???− ?(1 − ?)?? +?1??− ?1???− ?1???+ ???− ?1???− ?(1 − ?)???+ ?5(1 − ?1)??− ?1????− ?1?1???? +?(1 − ?)??− ?1????− ?????+ ?1?1????+ ?(1 − ?)???+ ?????− (1 − ?1)? − ?1? −?2? − ?1? + ?1? − ?1??− ?1??+ ?(1 − ?1)??− ?1??− ?1?? +?4(1 − ?)(1 − ?1)???− ????− ?1???− ???? Here it is important to note that in the absence of the disease, ?1?,(1 − ?1)?,?2?, ?(1 − ?1)??,?1??,????,?4(1 − ?)(1 − ?1)???,???? will be zero. Therefore, we have ?1(?) = ?1− (?1? + ?1??+ ?1??+ ?1???+ ?1???+ ?1????+ ?1????+ ?1? + ?1??+ ?1??+ ?1???) + ?1(1 − ?1) ?1(?) = ?1− ?1?1+ ?1(1 − ?1) ?1(?) = ?1+ ?1− (?1+ ?1)?1 ?1(?) + (?1+ ?1)?1≤ ?1+ ?1 (3.21) Now, we integrate both sides of (3.21) using integrating factor method (Kar and Jana, 2013; Birkhoff and Roffa, 1989). @ IJTSRD | Available Online @ www.ijtsrd.com | Volume – 2 | Issue – 5 | Jul-Aug 2018 Page: 1662
International Journal of Trend in Scientific Research and Development (IJTSRD) ISSN: 2456-6470 That is, ′+ ?3(?)?? = ?(?) ?1 ⟹ ?1≤ ?−∫?3(?)??(∫?∫?3(?)???(?)?? + ?2) Where ?3(?) = ?1+ ?1 ??? ?(?) = ?1+ ?1. The integrating factor is ?(?) = ?∫?3(?)??= ?∫(?1+?1)??= ?(?1+?1)?. Integrating (3.21) using the value of the integrating factor ?(?) = ?(?1+?1)? we get 1 ?(?)[∫?(?).?(?)?? + ?2] ?1(?) ≤ 1 ?(?1+?1)?[∫(?1+ ?1).?(?1+?1)??? + ?2] 1 ?(?1+?1)?[?1+ ?1 ? + ?1 ?1(?) ≤ [?1+ ?1 ?1+ ?1 ∴ ?1(?) ≤?1+ ?1 ?1+ ?1 ?1(?) ≤ .?(?1+?1)??? + ?2] ≤ .?(?1+?1)??? + ?2]?−(?1+?1)? + ?2?−(?1+?1)? (3.22) Where ?2 is the constant of integration and if we let ? → ∞, we have ?1(?) =?1+ ?1 ?1+ ?1 But = [? + ??+ ??+ ???+ ???+ ????+ ????+ ? + ??+ ??+ ???] (3.23) ?1(?1+ ?1)(?1+ ?1+ ?6) (?1+ ?1+ ?5)(?1+ ?1)(?1+ ?1+ ?6) − ?1?1?1 ? = We observe from the dynamic described by (3.1), (3.7) and (3.23) that the region (?,??,??,???,???,????,????,?,??,??,???) ∈ ℝ+ 11: ?1(?1+ ?1)(?1+ ?1+ ?6) (?1+ ?1+ ?5)(?1+ ?1)(?1+ ?1+ ?6) − ?1?1?1 [? + ??+ ??+ ???+ ???+ ????+ ????+ ? + ??+ ??+ ???] ≤?1+ ?1 ? ≤ Γ1= { ?1+ ?1} is positively invariant. In other words, the system is well posed mathematically since it has a positive invariant. Therefore, for the initial starting point ?1∈ ℝ+ the region Γ1. 3.9: BASIC REPRODUCTION NUMBER Definition 1`: Basic reproduction number of an infectious disease model denoted by ?0 is the average number of secondary infections caused by a single infectious individual during their lifetime (Driessche and Watmough, 2002). When the basic reproduction number is less than one, (?0< 1), the disease free equilibrium point is locally asymptotically stable. But if the basic reproduction number is greater than one, (?0> 1), then the disease free equilibrium point is unstable. We shall calculate ?0 using the next generation matrix by starting with those equations of the model that describe the production of new infections and change in state among infected individuals. We refer to these set of equations as the infected sub system and linearize them about the disease free steady state. From equation (3.24) we derive the infection subsystem as transmission part and transition part respectively. 11, the trajectory lies in Γ1. Thus, we focus our attention only on @ IJTSRD | Available Online @ www.ijtsrd.com | Volume – 2 | Issue – 5 | Jul-Aug 2018 Page: 1663
International Journal of Trend in Scientific Research and Development (IJTSRD) ISSN: 2456-6470 ??? ??= ?1? − ?1??− ?1??− ?5(1 − ?1)?? ??? ?? ???? ?? ???? ?? ????? ?? ????? ?? = ?(1 − ?1)? − ?1??− ???− ?(1 − ?)?? = ?1??− ?1???− ?1??? = ???− ?1???− ?(1 − ?)??? = ?5(1 − ?1)??− ?1????− ?1?1???? (3.24) = ?(1 − ?)??− ?1????− ????? ?? ??= ?1?1????+ ?(1 − ?)???+ ?????− (1 − ?1)? − ?1? − ?2? − ?1? ??? ?? ??? ??= ?(1 − ?1)??− ?1??− ?1?? ???? ?? = ?1? − ?1??− ?1?? = ?1(1 − ?)(1 − ?1)???− ????− ?1???− ???? } Let ? = [?,??,??,???,???, ????, ????, ?,??, ??,???]? where ? denotes transpose then we have the linearized infected sub system as transmission (?) and transition (?). ? ̂= (? + ?)? (3.25) The matrix ? corresponds to transmission part and it describes the the number of ways that new infections can arise. The matrix ? corresponds to transition part which describes the number of ways that individuals can move between compartments and it includes removal by death or acquisition of immunity. Therefore, from (3.24) we obtain the matrices @ IJTSRD | Available Online @ www.ijtsrd.com | Volume – 2 | Issue – 5 | Jul-Aug 2018 Page: 1664
International Journal of Trend in Scientific Research and Development (IJTSRD) ISSN: 2456-6470 @ IJTSRD | Available Online @ www.ijtsrd.com | Volume – 2 | Issue – 5 | Jul-Aug 2018 Page: 1665
International Journal of Trend in Scientific Research and Development (IJTSRD) ISSN: 2456-6470 By properties of determinant, we have that ➢If every element in a row (or column) of an ? × ? (square) matrix is zero, then the value of the determinant will be zero. ➢If the corresponding elements are equal in two rows (or column) of an ? × ? (square) matrix, then the determinant will be zero. Since the matrix above satisfies these two properties, we therefore state that the |??−?| = ? Here, we can now obtain the basic reproduction number ?0 from the trace and determinant of the matrix by letting ??−1= ?. Let ?0= ?(?) =1 2(????? (?) + √?????(?)2− 4det(?)) (3.26) Observe that det(?) = 0 So, ? ? + ?1 ?1+ ? + ? Thus, if ?0< 1, then the disease free equilibrium is stable and HBV infection can be controlled using the three control measure. On the other hand, if ?0> 1, then the disease free equilibrium is unstable and the HBV infection increases (persists’) in the population. 3.10: ENDEMIC EQUILIBRIM POINT This is the point where the disease cannot be totally eradicated but remains in the population. Let ?∗∗be the endemic equilibrium point. Therefore, for the disease to persist in the population, ?∗∗ must not be equal to zero at equilibrium. To calculate the endemic equilibrium point, we have ?∗∗= (?∗,?? ?1+ ?2+ 1+?4(1 − ?)(1 − ?1) ?1 +1 − ?1 ?1+ ?1 (3.27) ?0= + ∗,?? ∗,??? ∗,?∗) ≠ 0 ∗,?? ∗,??? ∗,??? ∗,???? ∗ ∗ ,?∗,?? ,???? @ IJTSRD | Available Online @ www.ijtsrd.com | Volume – 2 | Issue – 5 | Jul-Aug 2018 Page: 1666
International Journal of Trend in Scientific Research and Development (IJTSRD) ISSN: 2456-6470 If we solve equation (54) simultaneously, having in mind that ?∗∗≠ 0 we have that; ?(1 − ?1)?? (?(1 − ?1) − (?1+ ?1))?? ?4(1 − ?)(1 − ?1)??? (?4(1 − ?)(1 − ?1) − (? + ?1+ ?))??? ?1?? ∗=(?1+ ?1)?∗− ?2?∗− ???? ∗− ?1?? ∗= 0 (3.28) ∗− ?1?? ∗= 0 ∗− ???? ∗− ?1??? ∗= 0 (3.29) ∗− ???? ∗= 0 ∗+ ???? ∗+ ?2?∗− ?1?∗− ?1?∗= 0 ∗ (3.30) ?? ?1 ∗ ∗=(?1+ ?1)?∗− ?2?∗− ?1?? (3.31) ??? ? If we substitute (3.30) into (3.28) we obtain ∗ (?(1 − ?1) − (?1+ ?1))((?1+ ?1)?∗− ?2?∗− ???? ) = 0 ?1 ∗=(?1+ ?1)?∗− ?2?∗ (3.32) ??? ?1 Substituting (3.31) into (3.29) we have (?1(1 − ?)(1 − ?1) − (? + ?1+ ?))((?1+ ?1)?∗− ?2?∗− ?1?? ∗ ) = 0 ? ∗=(?1+ ?1)?∗− ?2?∗ (3.33) ?? ? ∗+ ???? ∗+ ?2?∗− ?1?∗− ?1?∗= 0 ?1?? Observe that ∗= 0 (?(1 − ?1) − (?1+ ?1))?? And ∗= 0 (?4(1 − ?)(1 − ?1) − (? + ?1+ ?))??? Then, we obtain ?2?∗− ?1?∗− ?1?∗= 0 ?2?∗ ?1+ ?1 (3.34) ?1?∗− ?1?? ?∗= ∗− ?1?? ∗= 0 ?1?∗ (?1+ ?1) (3.35) ∗= ?? ,∗+ ????? ∗ + ?(1 − ?)??? ?1+ ?2+ 1 ?(1 − ?)?? ∗ ∗ − (1 − ?1)?∗− ?1?∗− ?2?∗− ?1?∗= 0 ,∗+ ????? (3.36) + ?(1 − ?)??? ?1?1???? ?∗=?1?1???? ∗ ∗− ?1???? ∗ ∗ = 0 − ????? ∗ =?(1 − ?)?? ?1+ ? ∗ (3.37) ???? @ IJTSRD | Available Online @ www.ijtsrd.com | Volume – 2 | Issue – 5 | Jul-Aug 2018 Page: 1667
International Journal of Trend in Scientific Research and Development (IJTSRD) ISSN: 2456-6470 ∗− ?1???? ∗ ∗ = 0 ?5(1 − ?1) ?? ∗ − ?1?1???? =?5(1 − ?1) ?? ?1+ ?1?1 ∗ (3.38) ???? ,∗− ?(1 − ?)??? ,∗= 0 ∗− ?1??? ??? ∗ ??? ,∗= ?1+ ?(1 − ?) (3.39) ??? ∗− ?1??? ∗− ?1??? ∗= 0 ?1 ?? ∗ ?1 ?? ?1+ ?1 (3.40) ∗= ??? ?(1 − ?1)?∗− ?1?? ?(1 − ?1)?∗ ?1+ ? + ?(1 − ?) (3.41) ∗− ??? ∗− ?(1 − ?)?? ∗= 0 ∗ = ?? ?1?∗− ?1 ?? ?1?∗ ∗− ?1 ?? ∗− ?5(1 − ?1) ?? ∗ ∗= ?1+ ?1+ ?5(1 − ?1) (3.42) ?? ∗+ ?1?∗= 0 (3.43) ?1− ?1?∗− ?(1 − ?1)?∗− ?1?∗+ ?1??? ∗+ ?1?? ?1?∗ ?1 ?1− ?1?∗− ?(1 − ?1)?∗− ?1?∗+ ?1+ ?1+ ?5(1 − ?1)) ?1+ ?1( ?1?∗ ?1+ ?1+ ?5(1 − ?1)) ?(1 − ?1)?∗ ?1+ ? + ?(1 − ?)) ?(1 − ?1)?∗ ?1+ ? + ?(1 − ?)) ?1?∗ ?1+ ?1+ ?5(1 − ?1)) ?(1 − ?1)?∗ ?1+ ? + ?(1 − ?)) ?(1 − ?1)?∗ ?1+ ? + ?(1 − ?)) ?1?1(?5(1 − ?1) ?1+ ?1?1 )( ?1?1 ? 1 ?1+ ?2+ 1) +?(1 − ?)( + ?1+ ?(1 − ?))( +?(?(1 − ?)?? ?1+ ? ?1?1(?5(1 − ?1) ?1+ ?1?1 ( (?1+ ?1) ∗ )( ( ) )( ?1?2 ?1+ ?1 ? 1 ?1+ ?2+ 1) = 0 +?(1 − ?)( + ?1+ ?(1 − ?))( +?(?(1 − ?)?? ?1+ ? ( ∗ )( ( ) Let ? = (?1+ ?(1 − ?1) + ?1) ?1 ?1+ ?1( (?1+ ?2+ 1)((?5(1 − ?1) ?1+ ?1?1 ? = −?(1 − ?) (?1+ 1)(( (?1+ ?2+ 1)((?(1 − ?)?? ?1 ?1+ ?1+ ?5(1 − ?1)) ? = − ?1?1 ?1 ?1+ ?1+ ?5(1 − ?1))) ?(1 − ?1) ?1+ ? + ?(1 − ?))) ?(1 − ?1) ?1+ ? + ?(1 − ?))) ? = − )( ? ?1+ ?(1 − ?))( ∗ ? ? = − )( ?1+ ? @ IJTSRD | Available Online @ www.ijtsrd.com | Volume – 2 | Issue – 5 | Jul-Aug 2018 Page: 1668
International Journal of Trend in Scientific Research and Development (IJTSRD) ISSN: 2456-6470 ?1 ?∗= (3.44) (?1+ ?1))(? + ? + ?) + (?1?2 ?1?1 ?1+ ?1)(? + ? + ?) ? + ? + ( 3.11: SENSITIVITY ANALYSIS OF THE BASIC REPRODUCTION NUMBER OF HBV INFECTION The basic reproduction number ?0 is a function of eight parameters ?1,?2,?,?1, ?,?,? ??? ?1. To control the disease, these parameter values must control ?01 such that it will be less than one(?0< 1). Therefore, as the parameter values are changed, we find the rate of change of ?0. If we let ?4= (?1,?2,?,?1, ?,?,?,?1), then the rate of change of ?01 for a change in the value of parameter ?4 can be estimated from a normalized sensitivity index ?0=??0 ??4.?0 ?4 (3.45) Z?4 Table 1: The Parameter values for Hepatitis B virus infection used to calculate ??. Parameters Description ?? Natural death rate ?? individuals to recovered class Movement rate of susceptible individuals who are neither vaccinated nor use condom ?? Treatment rate of exposed (infected) individuals ?? recovered class ? Treatment rate of infectious individuals ? Rate of disease induced death Movement rate of non treated infectious individuals to recovered class Value Range 0.0219 Reference Adu et al, 2014 Movement rate of non treated exposed (infected) 0.88 Abdulrahman et al, 2013 ? 0.002 Assumed 0.7 Kamyad et al, 2014 Movement rate of treated infectious individuals to 0.98 Kimbir et al, 2014 0.98 0.0007 Kimbir et al, 2014 Abdulrahman et a, 2013 ? 0.508 Abdulrahman et al, 2013 To calculate the value of ?0, we use the parameters as stated in table 1. ? ? + ?1 0.002 0.0239+ The normalized sensitivity index of the basic reproduction number with respect to ?1,?2,?,?1, ?,?,? ??? ?1 is given by ?0=??0 ?= ?0=??0 ??1 ? (? + ?1)2+ (?1+ ? + ?)2 ?0=??0 ?1 ?1+ ?1 ?0=??0 ?2 ?1+ ?2+ 1+?4(1 − ?)(1 − ?1) 0.7 1.9019+ ?1 +1 − ?1 ?1+ ? ?0= + ?1+ ? + ? 0.3 1.0019= 0.76262 0.006 0.5236+ = ??.?0 (? + ?1)2(?0 ?1 ?) = 14619.311 Ζ? .?0 ?1 Ζ?1 (?1+ ?2+ 1)2+?4(1 − ?)(1 − ?1) ?1 1 − ?1 (?1+ ?1)2)(?0 ?) = −38.9114493 = −( + ?4(1 − ?) ?1+ ? + ?)(?0 ??1.?0 1 1 ?1) = −0.39687895 Ζ?1 = ( ?1+ ?2+ 1− − ??2.?0 (?1+ ?2+ 1)2(?0 ?1 ?2) = −0.31895975 Ζ?2 = − @ IJTSRD | Available Online @ www.ijtsrd.com | Volume – 2 | Issue – 5 | Jul-Aug 2018 Page: 1669
International Journal of Trend in Scientific Research and Development (IJTSRD) ISSN: 2456-6470 ?= −?4(1 − ?1) ?0=??0 ??.?0 ?1+ ? + ?(?0 ?) = −0.44586536 Ζ? ?= −?4(1 − ?)(1 − ?1) (?1+ ? + ?)2 ?0=??0 ??.?0 (?0 ?) = −23.8430637 Ζ? ?= −?4(1 − ?)(1 − ?1) (?1+ ? + ?)2 ?0=??0 ??.?0 (?0 ?) = −0.03285462 Ζ? (1 − ?1) (?1+ ?1)2= −0.32712716 ?0=??0 .?0 ?1 Ζ?1 = ??1 Table 2: The effect of the parameters on ??. Parameters Value Range Effect on ??? ?? 0.0219 ?? 0.88 ? 0.002 ?? 0.7 ?? 0.98 ? 0.98 ? 0.0007 ? 0.508 −38.9114493 −0.31895975 14619.311 −0.39687895 −0.32712716 −0.445865 −23.8430637 −0.03285462 The sensitivity index ?(?) is positive and this shows that the value of ?0 increases as the value of ? increases. The remaining indices ?(?1),?(?1),?(?2),?(?1),?(?),?(?) ??? ?(?) are negative, indicating that the value ?0 decreases as ?1,?1,?2,?1,?,? ??? ? increases. Actually, the effectiveness of control may be measured by its effect on ?0. Once the parameters ?1,?1,?2,?1,?,? ??? ? will reduce ?0< 1, then it is curative if the reduction can be maintained. Therefore, the endemicity of the will be reduced if there is increase in the value of the following parameters; the rate at which exposed (infected) individuals obtain treatment (?1), natural death rate of the exposed and infectious individuals (?1), spontaneous recovery rate by exposed individuals (?2), disease induced death rate of infectious individuals (?), rate at which treated infectious individuals move to recovered class (?), rate at which infectious individuals receive treatment (?) and the rate at which the received treatment is effective (?1). This implies that these parameters can help in reducing the rate of HBV infection over time and if it is maintained, the transmission of the disease may decrease, causing the cases in the population to go below an endemicity threshold. IV. Analysis of Result We consider the parameter set ∆= {?,?,?, ?1,?1,?5,?,?1?1,?(1 − ?),?,?1,?2,?,?4,?1,?,?,?1,?1,?1,?1}; some of these parameters are taken from published articles and some are assumed with feasible values. More so, we consider ∇= {?0,??0, ??0,???0,???0, ????0, ????0, ?0,??0,??0,???0, ?0} as the initial condition for the simulation of the model. We compare the results; having no control and having both vaccine, condom and treatment controls. With the parameter values in table 1, the system asymptotically approaches the endemic equilibrium ?∗∗= (8.62693005,0.86183812,0.09575979, 0.95879491,0.3836662,1.5315378,0.52086904,0.073104,0.073104,0,0,0.12663685). The basic reproduction number is given as; ?0= ?1+?+? and the value of the basic reproduction number is ?0= 0.76262 which is less than one. Thus, since ?0< 1, then the disease free equilibrium is stable and HBV infection can be controlled in the population using the three ?1+?2+1+?4(1−?)(1−?1) ? ?1 1−?1 ?1+?1 ?+?1+ + @ IJTSRD | Available Online @ www.ijtsrd.com | Volume – 2 | Issue – 5 | Jul-Aug 2018 Page: 1670
International Journal of Trend in Scientific Research and Development (IJTSRD) ISSN: 2456-6470 control measure. This confirms the result of the sensitivity analysis of ?0in table 2, where ? (the rate at which the infectious individuals are treated), ?1 (the rate of the exposed individuals who obtain treatment) and ?2 (the rate of exposed individuals who spontaneously recover from the infection) are all negative and it shows that when all these parameters increases, the average number of secondary infections caused by a single infectious individual during their lifetime (I.e, ?0), will decrease. This implies that with effective control measure, the future number of HBV infection cases will decrease as the parameters ?1,?2,?1,?1?,?,? increases because even though individuals remain infectious for a longer period and consequently can infect more individuals, the rate of progression to disease decreases. @ IJTSRD | Available Online @ www.ijtsrd.com | Volume – 2 | Issue – 5 | Jul-Aug 2018 Page: 1671
International Journal of Trend in Scientific Research and Development (IJTSRD) ISSN: 2456-6470 Figures (2a – 2c): Numerical simulation of the basic reproduction number ?0 using different rate of ?,?1 ??? ?2 , where ?1 ??? ?2 are respectively represented with b4 and b5. The effect of the three control measures on the disease dynamics may be well understood if we consider Figures 2a, 2b and 2c which explains how control reproduction ratio ?0evolve with different rate of ?,?1 ??? ?2 where ?1 ??? ?2 are respectively represented with b4 and b5 in figure 2b and 2c above. It is seen that condom, vaccination and treatment reduces the value of ?0 effectively. But an integrated control works better than either of the control measures. Figure (3ai – 3axii): Numerical simulation of the model system (3.1) when there is no control with time ranging from 0 – 6months. @ IJTSRD | Available Online @ www.ijtsrd.com | Volume – 2 | Issue – 5 | Jul-Aug 2018 Page: 1672
International Journal of Trend in Scientific Research and Development (IJTSRD) ISSN: 2456-6470 Figure (3bi – 3bxii): Numerical simulation of the model system (3.1) when there is no control with time ranging from 0 – 1year. @ IJTSRD | Available Online @ www.ijtsrd.com | Volume – 2 | Issue – 5 | Jul-Aug 2018 Page: 1673
International Journal of Trend in Scientific Research and Development (IJTSRD) ISSN: 2456-6470 Figure (4ai – 4axii): Numerical simulation of the model system (3.1) when there is control with time ranging from 0 to 6months. @ IJTSRD | Available Online @ www.ijtsrd.com | Volume – 2 | Issue – 5 | Jul-Aug 2018 Page: 1674
International Journal of Trend in Scientific Research and Development (IJTSRD) ISSN: 2456-6470 Figure (4bi – 4bxii): Numerical simulation of the model system (3.1) when there is control with time ranging from 0 to 1year. Here, we numerically solve the control system (3.1) which consists of twelve differential equations. We have plotted susceptible individuals, vaccinated individuals, non vaccinated individuals, vaccinated individuals who use condom, vaccinated individuals who does not use condom, non vaccinated individuals who use condom, non vaccinated individuals who does not use condom, Exposed (infected) individuals, Exposed but treated individuals, infectious but treated individuals, infectious but not treated individuals and @ IJTSRD | Available Online @ www.ijtsrd.com | Volume – 2 | Issue – 5 | Jul-Aug 2018 Page: 1675
International Journal of Trend in Scientific Research and Development (IJTSRD) ISSN: 2456-6470 recovered individuals, by considering values of the parameters in table 5 and we simulated the system at different level of ?1,?1, ?,?1 and d. From figures (3ai – 3axii) and (3bi – 3bxii), we see that the number of both the exposed and the infectious population increases when there is no control. Also from (4ai – 4axii) and (4bi – 4bxii), we observe that the application of control (vaccination, condom and treatment) gives a better result than when there is no control because the population of the exposed and the infectious individuals is reduced. This implies that effective vaccination with appropriate use of condom (condom efficacy) is able to reduce the density of the exposed (infected) individuals, while application of treatment is able to reduce the density of the infectious individuals. Therefore, since our main purpose is to reduce the density of the exposed and infectious individuals and increase the density of the removed with or without permanent immunity, we can conclude that the numerical simulation result shows that combination of vaccination, condom and treatment is the most effective way to control Hepatitis B virus infection. V. Summary and Conclusion To control HBV infection at least 96% 0r more of newborns should be vaccinated and effort should be made to vaccinate more than 50% of the sexually active susceptible individuals who should also be encouraged to use condom during sex as these combination will go a long way in reducing the density of the exposed (infected) individuals. Also, treatment strategies are needed to control the spread of HBV infection in the population since control of HBV infection implies reducing the susceptible and exposed by vaccination and reducing the infectious by treatment. REFERENCES 1.Abdulrahman S, kinwinde A, Abubakar U Y, Awojojyobe O B (2013). Mathematical solutions for hepatitis B virus infection in Nigeria; JRIND 11(1) ISSN 1556-8308. 2.Adu I K, Aidoo A Y, Darko I O, Frimpong E O . (2014). Mathematical model of hepatitis B in Bosomtwe District of Ashanti Region, Ghana. . Applied Mathematical science , vol8, No. 67, 3343-3358. 3.Ahmed A, Al Jamimi D M, Isab A A, Auchawajah A M A, Shawarby M A, (2012) Histological Change in Kidney and Liver of Rats Due to Gold III Compound [Au(en)??2]Cl. https://doi.org/w.1371/ journalpone.oo51889. 4.Arauz-Ruiz P, Norder H, Robertson B H, Magnius L O. (2002). Genotype H a new American genotype of Hepatitis B virus revealed in central America. J. Gen. Virol, 83(pt 8):2059-73. 5.Birkhoff G and Rota G C (1989) ordinary differential equation, John Wiley and sons, New York, N Y, USA, USA 4th edition. 6.Bonino F C (1987). serological markers of HBV infectivity . Ann. 1st supper sanita, 24(2):507-539. 7.Center for Disease Control and Prevention. (2012). Retrieved www.cdc.gov/hepatitis /HBV. 8.Chang, M (2007). hepatitis B virus infection. semin fetal Neonatal Med , 12(3):160-167. Chu C M, Liaw X F (2007). Predictive factors for reactivation of Hepatitis B following Hepatitis Be antigen seroconversion in chronic Hepatitis B. Gastroenterology, 133(5):1458-65. 9.Chu C M, Liaw X F (2007). Predictive factors for reactivation of Hepatitis B following Hepatitis Be antigen seroconversion in chronic Hepatitis B. Gastroenterology, 133(5):1458-65. 10.Coffin C, Mulrooncy-Cousins P, Van Marle G, Roberts J, MichalaK J, Terrault N. (2011). Hepatitis B virus (HBV) quesispecies in hepatic and extra hepatic viral reservoirs in liver transplants on prophylactic therapy. liver transpl 17(18): 955-62 doi: 1002/ it 22312 PMID 21462295. 11.Corazon D (2015). What is serum hepatitis. Wise Geek . 12.Dontwi I K, Frempong N K and Wiah E N, (2010) Using Mathematical Model to Depict the Immune Response to Hepatitis B Virus Infection. American Journal of Scientific and Industrial Research, 1(3) 516 – 526. 13.Gerlich W H, (2013). Medical Virology of Hepatitis B: How it Began and Where we are Now. Virology https://doi.org/10.1186/1743-422x-10-239 14.Gharib-Zahidi M R, Ghaemi M. (2012). Kinetics of Hepatitis B Virus Infection: A cellular Automation Model Study. Journal of Paramedical Sciences, Vol. 3, No. 3, pp. 2-8. PLOS. from http:// Journal @ IJTSRD | Available Online @ www.ijtsrd.com | Volume – 2 | Issue – 5 | Jul-Aug 2018 Page: 1676
International Journal of Trend in Scientific Research and Development (IJTSRD) ISSN: 2456-6470 15.Glebe D, Urban S (2007). Vriral and cellular determinants involved in hepadnaviral entry. World Journal:Gastroenterol, 13(1):22-38. 16.Jayapal, V. (2007). "fundamental of medical immunology. ISBN 81-8448-048-2,. 17.Kamyad A V, Akbari A, Heydari A A heydari A (2014). Mathematical modeling of transmission Dynamics and optimal control of vaccination and treatment for hepatitis B virus. computational and mathematical methods 1155/475451. 18.Kar T K and Jana S. (2013). A theoretical study on mathematical modeling of an infectious Disease with application of optimal control. Biosystems , vol. 111.no. 1, pp.37-50. 19.Keeling M J and Rohani P. (2008). Modeling infectious diseases in humans and animals. Princeton University press: Princeton, USA. 20.Kimbir A R, Aboiyar T, Abu O, Onah E S. (2014). Simulaation Of a Mathematical Model Of Hepatitis B Virus Transmission Dynamics In The Presence Of Vaccination Mathematical Theory and modeling, ISSN 2224- 5804, vol. 4, No. 12 . 21.Kosinska A D, zhang E, Johrden L, liu J, Seiz P L Zhang X, Ma Z, Kemper J, Fiedler M, Glebe D, wIldner O, Dittmer U, Lu M, Roggendorf M (2013). Combination of DNA prime adenovirus boost immunization sustained control of chronic hepatitis B in the woodchuck Model . PLoS pathog, 9:el003391. 22.Lok A, McMahon B . (2007). Chronic hepatitis B. Hepatology 45(2): 507-39. 23.Momoh, A A, Ibrahim M O, Madu B A, Asogwa K K (2012). Global equilibrium stability of hepatitis B model and vaccination impact. ResearchJounal mathematic and statistics , 4(3) 57-62 ISSN: 2040-7505. 24.Moneim A I, Khalil H A (2015). Modeling and simulation of the spread of HBV Disease with infeatious Latent. Applied Mathematics, 6, 745- 753. 25.National centre for immunization and respiratory disease(NCIRD), N. C. (2014). 26.Nowak M A,Bonhoeffer S, Hill A M, Boehme R, Thomas H C, McDade H. (1996). Viral dynamics in Natr.Acad.Sci.USA. 93(9): 4398-4402. 27.Obaid M A and Elaiw A M (2014) Stability of Virus Infection Models with antibodies and chronically infected Cells. Hindawi Publishing Corporation Abstract and Applied Analysis. http://dx.doi.org/1001155/2014/6950371. 28.O'leary C, Hong Z, Zhang F, Dawood M, Smart G, Kaita K and Wu J. (2008). Mathematical Model to Study the Effect of Hepatitis B Virus Vaccine and Anti Viral Treatment among the Canadian Inuit Pop[ulation. CDC 29.Pan C Q, Zhang J X. (2005). Natural history and clinical consequences of hepatitis B virus infection. International Journal of Medical Science, 2(1): 36-40. 30.Shapiro C N (1993). Epidemology Of Hepatitis B. Pediatr. Infect. Dis. J., 12(5): 433-437. 31.Shi Z, Yang Y, Wang H, Ma L, Schreiber A, Li X, Sun W, Zhao X, Yang X, Zhang L, Lu w, Teng J, An Y. (2011). Breastfeeding of Newborns by Mothers carrying Hepatitis B Virus:A Meta- analysis and systematic Review. Archives of Pediatrics and Adolescent medicine, 165(9):837- 846. 32.Southern Nevada Health District (SNHD).(2015). (702) 759 snhdpublicinformatio@suhdmail.org. 33.Texas Biometrical Research Institute Publication (2013). 34.World Health Organization. Hepatitis B fact http:www.who.int/mediacentre/factsheets/fs204/e n/ 35.Zou L, Zhang W, Ruan S. (2009). Modeling the transmission dynamic and contro of hepatitis B virus in china. International Journal epidemial, 29-52. 36.Zou L, Zhang W and Ruan S . (2010). Modeling the transmission dynamics and control of Hepatitis B Virus infection in China. Journal of Theoretical Biology , Vol. 262, No. 2, pp. 330-338. 37.Zoulim F (2004). Antiviral therapy of chronic hepatitis B: Can we clear the virus and prevent drug resistance? Antivir Chem Chemother 15: 299–305. hepatitis B virus infection. Proc medicine, doi: in and Treatment. - 1300 with entecavir elicits (2015), ceo from 204: sheet @ IJTSRD | Available Online @ www.ijtsrd.com | Volume – 2 | Issue – 5 | Jul-Aug 2018 Page: 1677