Download
1 / 28
280 likes | 284 Views
Effects of Extreme High Flow Events on Macroinvertebrate Communities in Vermont Streams. Jen Stamp , Jeroen Gerritsen & Anna Hamilton - Tetra Tech, Inc. Aaron Moore - Vermont Agency of Agriculture Food and Markets (AAFM )

E N D
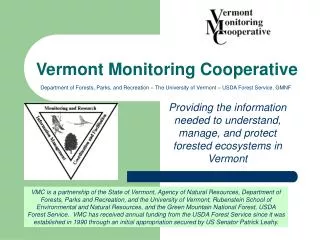
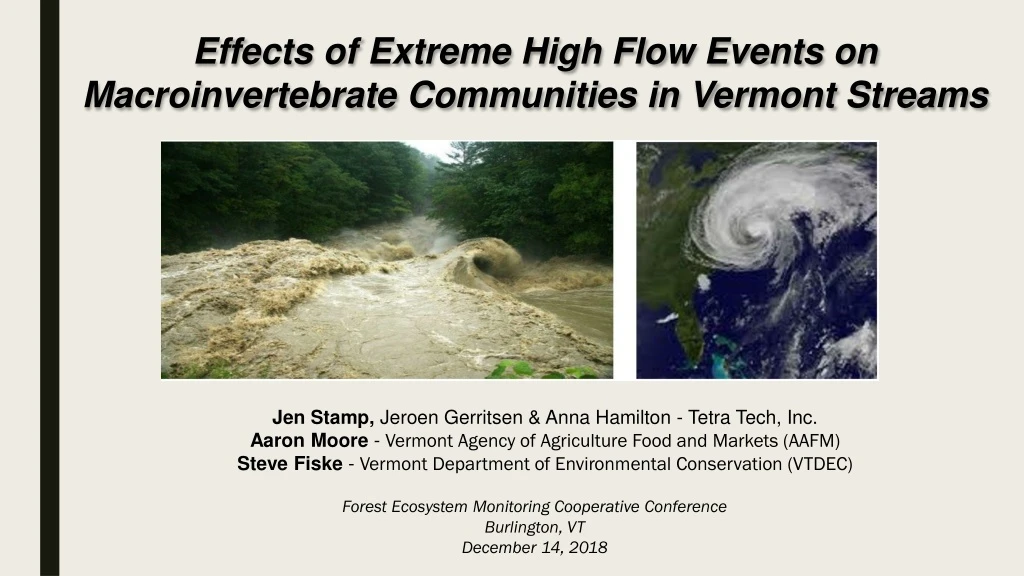
Effects of Extreme High Flow Events on Macroinvertebrate Communities in Vermont Streams Jen Stamp, Jeroen Gerritsen & Anna Hamilton - Tetra Tech, Inc. Aaron Moore- Vermont Agency of Agriculture Food and Markets (AAFM) Steve Fiske-Vermont Department of Environmental Conservation (VTDEC) Forest Ecosystem Monitoring Cooperative Conference Burlington, VT December 14, 2018
Up-Front Acknowledgments Data were provided by VT DEC, along with some of the photos and slides (as well as in-depth knowledge about the sites and taxa). Aaron Moore Steve Fiske
Acknowledgments Britta Bierwagen –Tetra Tech’s work on this project has been funded by EPA/ORD. It contributes to the furthering of our knowledge about the effects of climate change on biological communities and potential impacts on biomonitoring programs. & Disclaimer… The views expressed in this presentation are those of the author and they do not necessarily reflect the views or policies of the U.S. Environmental Protection Agency, VT DEC or other collaborating agencies.
Extreme climatic events (ECEs) Ecosystems are experiencing not only gradual shifts in mean climate conditions but also changes in the frequency, magnitude, timing, and duration of ECEs such as droughts, floods, severe storms, and heat waves. ECEs are projected to become more frequent and more intense with ongoing climate change. These types of events can dramatically affect ecological and evolutionary processes. Percent changes in the amount of precipitation falling in very heavy events (the heaviest 1%) from 1958 to 2012 for each region. There is a clear national trend toward a greater amount of precipitation being concentrated in very heavy events, particularly in the Northeast and Midwest. (Figure source: updated from Karl et al. 2009). There is a lack of long-term time-series data from natural systems that capture the response and recovery of organisms to extreme events.
Irene - the perfect storm • 2011 = wettest year on record • Irene rainfall 4-8 inches 24HR • Of 16 long-term USGS flow gages 10 set record flows, all in top 3 flows recorded • Groundwater at record high levels August 28-29 24 Hour Rainfall Total (NOAA)
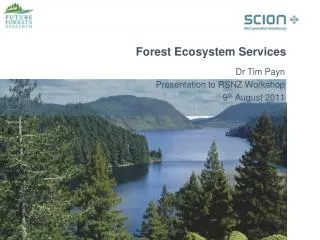
Goals Evaluate the effects of high flows associated with Irene on macroinvertebrates, substrate composition and periphyton cover 2) Better understand potential effects of more frequent and intense high flow events on the VT DEC’s bioassessment program.
Study Sites Nine ‘reference’ streams monitored on an annual basis from 2009-2013
Represent 3 different stream types for macroinvertebrate communities Small High Gradient (SHG) Medium High Gradient (MHG) Warm Water Moderate Gradient (WWMG) • Increased Drainage Area and Order • Increased Slope • Decreased Elevation • Decreased Canopy Cover • Increased % Fine Sediments • Increased pH, Alkalinity, Conductivity, Temperature
Small High Gradient (SHG) Streams Photos provided by Jim Deshler, VT DEC Smith Bingo Ranch Kidder
Medium High Gradient (MHG) Streams Photos provided by Jim Deshler, VT DEC East Branch North Winhall White
Warm Water Moderate Gradient (WWMG) Streams Photos provided by Jim Deshler, VT DEC Lewis Nulhegan
The sites capture a range of exposures (some were hit harder than others) On average, the SHG and MHG sites received the greatest amount of rainfall (about 6.5”), with one site (East Branch North) receiving over 7”of rain. The two WWMG sites (Lewis and Nulhegan) received the least amount of rain (3-4”).
Hydrologic Data Six sites were matched with USGS gages. North River gage (matched with East Branch North site) - highest annual peak flow during Irene. Its period of record (POR) begins in 1940. White River gage (matched with Bingo, Smith and White) - second highest annual peak flow during Irene. POR begins in 1916. Atypical timing (high flows in Vermont typically occur during spring runoff and are driven largely by snowmelt) East Branch North had its highest annual peak flow on record during TS Irene
MacroinvertebrateCollection Kick samples are taken from riffle habitats in 4 different locations in the sampling reach. At each location the substrate is disturbed for approximately 30 seconds, for a total active sampling effort of 2 minutes. D-frame net with 500-μm mesh. Biomonitoring index period: Sept 1st – Oct 15th METHODS • In 2011, sampling dates ranged from one week to one month after Irene. • 2011 data were compared to samples collected two years before and two years after Irene. • Pre: 2009-2010 • Irene: 2011 • Post: 2012-2013 • Note: two sets of samples were collected from Ranch in 2011 (one 11 days after Irene and the other 57 days after).
MacroinvertebrateProcessing • Subsampled in lab, minimum of 25% or 300 individuals • Identified to species or lowest possible level METHODS
VT DEC Macroinvertebrate Biocriteria INPUT METRICS METHODS
Macroinvertebrate Metric Thresholds Assessments based on passing thresholds for all metrics for a given assessment level, with opportunities for some BPJ Ratings range from excellent to poor. METHODS
Pebble Count Estimated riffle substrate composition using a modified pebble count. Approximately 100 randomly-selected substrate particles were examined in each reach. METHODS Rapid Periphyton Assessment Estimated algal cover (moss & macro-algae cover, micro-algae thickness) in conjunction with pebble counts.
Analyses • ANOVA • One-way: differences between mean values of the three “Event” groups (pre/Irene/post) • Two-way: interactions between “Event” and “Type” (SHG, MHG, WWMG) • p-values <0.1 were interpreted as indicating significant association • Interpret with caution: small sample size and non-random site selection • Scatterplots • Visualize temporal patterns and year-to-year variability • Separate sets of plots for each stream type (SHG, MHG, WWMG) • Included all samples collected from 2000 to 2015 • Non-metric multidimensional scaling (NMS) ordinations • Look for changes in taxonomic composition associated with Irene • 2009-2013 macroinvertebrate presence-absence & relative abundance data METHODS
Macroinvertebrate Density Showed the most consistent, noticeable change in 2011 (Irene), with mean values decreasing strongly.Densities rebounded the following year. RESULTS Density reduction was most evident at the SHG and MHG sites, which, on average, received the greatest amount of rainfall during Irene.
Total Taxa Richness Did not show a significant association with “Event” but mean values did decrease in all three stream types in 2011. Largest reduction in mean richness occurred at the MHG sites, and were slower to rebound to pre-Irene levels. Reduced richness was likely driven in part by the reduced densities (with fewer organisms in the samples, there are likely to be fewer taxa). The dramatic decrease in densities but not richness metrics suggests that the scouring flows were not selective in eliminating certain types of taxa or functional feeding groups. Many taxa were likely able to find refugia in sheltered microhabitats, and some likely drifted in from upstream tributaries. RESULTS
Bioassessment Scores At five of the SHG and MHG sites, densities in 2011 were below the VT DEC’s biocriteria density threshold of 300 organisms per square meter, which lowered macroinvertebrate biocriteria scores at those sites. Dquick to rebound the following yearsensities were. RESULTS
NMDS Ordination • Taxonomic composition most strongly driven by variables related to stream type • Some of the 2011 samples were distinctively further from the non-Irene samples in ordination space (suggesting that shifts in taxonomic composition may have occurred in association with Irene) • Fair amount of inter-year compositional change at the sites unrelated to TS Irene RESULTS Orthogonal, two-axis solution
Individual Response Patterns At some sites, such as Kidder and Bingo, Baetistricaudatus complex made a rapid recovery following the flood, increasing in relative abundance compared to the two years prior to TS Irene. RESULTS Dolophilodes (a common but intolerant filter-feeding caddisfly that attaches to the underside of cobble/boulder substrate) was absent or decreased in relative abundance at 6 of the 7 SHG and MHG sites in 2011 when compared to pre-Irene levels, and in several streams the population did not fully rebound within the two years following the flood.
Substrate & Periphyton • Data were variable from year to year and statistically non-significant. • Substrate: • Some patterns did emerge with sand and gravel that were likely related to mobilization of substrates during the high flows associated with TS Irene (and likely contributed to reductions in macroinvertebrate densities and periphyton cover). • Results suggest that some substrates moved during the high flows associated with TS Irene, and may have been replaced by similar-sized particles from upstream (thus not significantly changing overall substrate composition). However, we have no way of formally testing this theory. • Periphyton: • Overall decrease in moss or periphyton cover in 2011, potentially due to scour. This pattern was most evident with micro-algae at MHG sites. • Our sites were ‘reference’ streams with low nutrient concentrations and low periphyton cover. If comparable data had been available for nutrient enriched sites with higher periphyton cover, we believe a scouring effect would have been more evident. RESULTS
QUESTIONS? COMMENTS? Jen Stamp (Jen.Stamp@tetratech.com) Aaron Moore (Aaron.Moore@vermont.gov) Steve Fiske (Steve.Fiske@vermont.gov)