Download
1 / 1
10 likes | 23 Views
Axis Direct presents daily derivatives report presenting recommendations based on technical analysis. For trading in derivatives visit https://simplehai.axisdirect.in/offerings/products/derivatives<br>https://simplehai.axisdirect.in/share-stock-prices/nse/Bharat-Petroleum-Corporation-Ltd-2290<br>https://simplehai.axisdirect.in/share-stock-prices/nse/Tata-Consultancy-Services-Ltd-5400

E N D
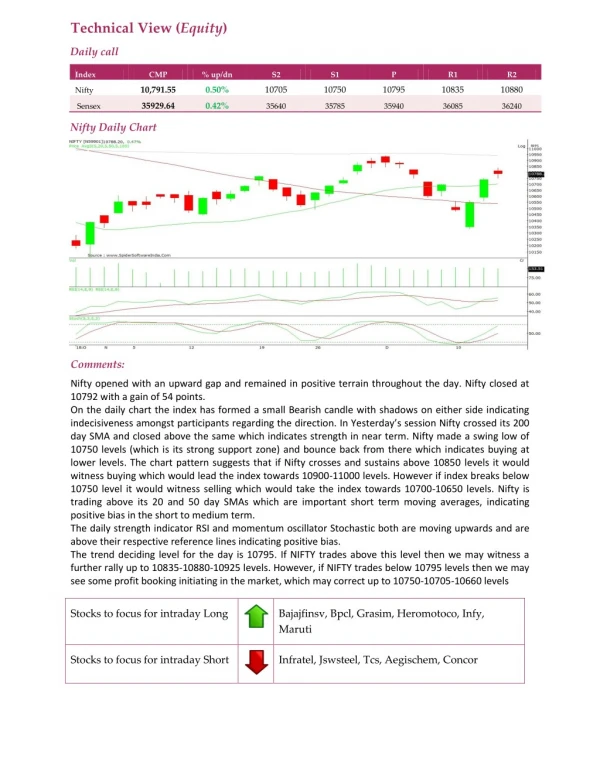
Technical View (Equity) Daily call Index CMP % up/dn S2 S1 P R1 R2 10,791.55 0.50% 10705 10750 10795 10835 10880 Nifty 35929.64 0.42% Sensex 35640 35785 35940 36085 36240 Nifty Daily Chart Comments: Nifty opened with an upward gap and remained in positive terrain throughout the day. Nifty closed at 10792 with a gain of 54 points. On the daily chart the index has formed a small Bearish candle with shadows on either side indicating indecisiveness amongst participants regarding the direction. In Yesterday’s session Nifty crossed its 200 day SMA and closed above the same which indicates strength in near term. Nifty made a swing low of 10750 levels (which is its strong support zone) and bounce back from there which indicates buying at lower levels. The chart pattern suggests that if Nifty crosses and sustains above 10850 levels it would witness buying which would lead the index towards 10900-11000 levels. However if index breaks below 10750 level it would witness selling which would take the index towards 10700-10650 levels. Nifty is trading above its 20 and 50 day SMAs which are important short term moving averages, indicating positive bias in the short to medium term. The daily strength indicator RSI and momentum oscillator Stochastic both are moving upwards and are above their respective reference lines indicating positive bias. The trend deciding level for the day is 10795. If NIFTY trades above this level then we may witness a further rally up to 10835-10880-10925 levels. However, if NIFTY trades below 10795 levels then we may see some profit booking initiating in the market, which may correct up to 10750-10705-10660 levels Stocks to focus for intraday Long Bajajfinsv, Bpcl, Grasim, Heromotoco, Infy, Maruti Stocks to focus for intraday Short Infratel, Jswsteel, Tcs, Aegischem, Concor