Download
1 / 11
130 likes | 336 Views
PDII Survey. Conducted by Westat in English and Spanish Start with CPS Autor & Handel, Blinder, Kleiner, Krueger, Blau & Kahn, Hall, Freeland helped design new questions on job skills, offshoring, occupational licensing, experience, job search, etc. Focus group tests

E N D
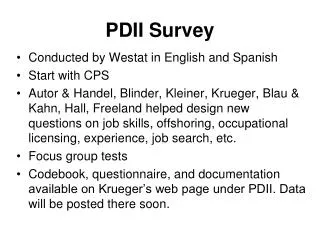
PDII Survey • Conducted by Westat in English and Spanish • Start with CPS • Autor & Handel, Blinder, Kleiner, Krueger, Blau & Kahn, Hall, Freeland helped design new questions on job skills, offshoring, occupational licensing, experience, job search, etc. • Focus group tests • Codebook, questionnaire, and documentation available on Krueger’s web page under PDII. Data will be posted there soon.
More on PDII Survey • Universe: Individuals age 18 or older in the labor force • 2,513 eligible individuals were interviewed June 5-July 20, 2008 • Asked about last job for those not currently employed • Random digit dial sampling design • One respondent randomly selected from eligible household to complete the survey • Up to 15 callbacks made to try to elicit responses.
More on PDII Survey 28% of sampled eligible households agreed to participate in the screening questions, and 64% of the selected individuals in screened households completed the questionnaire. Response rate was 17.9%, using AAPOR definition 3 Sample weights: primarily match the marginal distributions of the Current Population Survey by sex, age, education, census region, urbanization, race, Hispanic ethnicity, employment status, and class of employer Note issue with hourly wage data – didn’t build in checks for overtime, tips and commissions that are in CPS
Q6A. What kind of work do you do, that is, what is your occupation? (IF NECESSARY: For example, Plumber, Typist, or Farmer) ____________________________________________________________ Q6B. What kind of work do you do, that is, what is your occupation? (IF NECESSARY: For example, Electrician, Sales Person, or Mechanic) ____________________________________________________________ ** Randomly assigned respondents to Version A and Version B. Split Ballot Experiment: Occupation
Results Version A Version B Plumber, Typist, 1.2% 0.9% or Farmer Electrician, Sales Person, 6.3% 6.3% or Mechanic Differences between A and B are not statistically significant at 0.10 level. N equals 1,305 for version A and 1,191 for version B.
Results Version A Version B Plumber, Typist, 3.6% 2.9% Farmer or Secretary Electrician, Sales Person, 6.3% 6.3% or Mechanic Differences between A and B are not statistically significant at 0.10 level. N equals 1,305 for version A and 1,191 for version B.
Make Things, Repair Things or Provide Services Q8. Would you say that on your own job you mainly provide services, repair things, or make things? DK 2.0% REFUSED 0.5 PROVIDE SERVICES 78.6 REPAIR THINGS 8.3 MAKE THINGS 10.6 N = 2,274
Make, Repair or Serve by Industry Q8. Would you say that on your own job you mainly provide services, repair things, or make things? Ag, Mfg, Everything Mining, ConstrElse PROVIDE SERVICES 52.3% 88.0% REPAIR THINGS 20.3 5.4 MAKE THINGS 27.4 6.7
Another Novel Question • GED Status asked of all people with at least high school: Q39a. Do you have a GED or a regular high school degree? GED ……………….………………1 Regular high school degree……..2
GED • 160 GED recipients (9.1% of HS and above) • 17% of exactly HS have GED • 5% of those with >HS have GED • In Wage Equation: GED recipients earn 9% less (t=1.98) • In Wage Equation for >HS sample, GED recipients earn 28% less (t=4.01)