NACP
NACP. On network design for the detection of urban greenhouse gas emissions: Results from the Indianapolis Flux Experiment (INFLUX).

NACP
E N D
Presentation Transcript
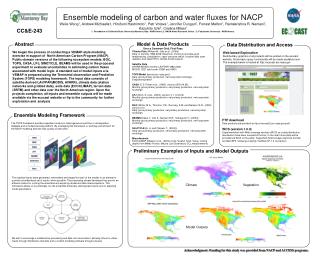
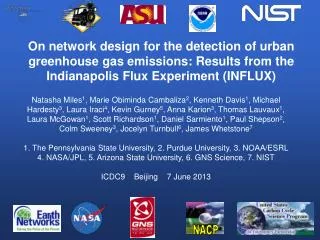
NACP On network design for the detection of urban greenhouse gas emissions: Results from the Indianapolis Flux Experiment (INFLUX) Natasha Miles1, Marie Obiminda Cambaliza2, Kenneth Davis1, Michael Hardesty3, Laura Iraci4, Kevin Gurney5, Anna Karion3, Thomas Lauvaux1, Laura McGowan1, Scott Richardson1, Daniel Sarmiento1, Paul Shepson2, Colm Sweeney3, Jocelyn Turnbull6, James Whetstone7 1. The Pennsylvania State University, 2. Purdue University, 3. NOAA/ESRL 4. NASA/JPL, 5. Arizona State University, 6. GNS Science, 7. NIST ICDC9 Beijing7June 2013
INFLUX motivation • Emissions mitigation will happen at local and regional scales. • Validation of emissions mitigation will(?) require (independent) measurements • Atmospheric GHG measurements have the potential to provide such independent emissions estimates.
INFLUX objectives • Develop improved methods for determination of urban area-wide emissions, and spatially and temporally-resolved fluxes of greenhouse gases, specifically, CO2 and CH4. • Determine and minimize the uncertaintyin the emissions estimate methods.
INFLUX methodology: Simultaneous application of multiple methods • Inventory estimates of sector-by-sector emissions at high spatial resolution • Periodic aircraft flights with CO2, CH4, and flask samples - Whole city flux estimates • Periodic automobile surveys of CO2 and CH4 – Emissions from strong point sources (power plants, landfill, gas leaks) • 12 surface towers measuring CO2, 5 with CH4, and 5 with CO & Mesoscale atmospheric inversion - Spatially and temporally resolve GHG emissions • 5 automated flask samplers from NOAA – Identify sectoralemissions • TCCON-FTS for 4 months (Sept-Dec 2012) • 4 eddy-flux towers from natural to dense urban landscapes – Model assessment (June 2013) • Doppler lidar (installed late April 2013) • Tracer release experiment (planned August 2013)
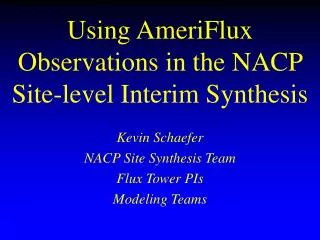
Vulcan and Hestia Emission Inventories / Models 250m res - Indy Hestia: high resolution emission data for the residential, commercial, industrial, transportation and electricity production sectors. Vulcan – hourly, 10km resolution for USA http://hestia.project.asu.edu/
INFLUX observational results to date: Aircraft and automobiles
Aircraft mass balance approach: 1 June 2011 Flight path Cambaliza et al, in prep
1 June 2011 Results Cambaliza et al, in prep 50 ppb CH4 8 ppm CO2 22,000 moles s-1 203 moles s-1
CO2 Emissions: Aircraft mass balance vs Hestia inventory • Aircraft mass balance: uncertainty based on measurements of plume at different distances from source: 40% • More day-to-day variability in mass balance results Cambaliza et al, in prep
Drive-arounds: Separation/quantification of CH4 sources WWTP Instrumented surface vehicles to identify and quantify individual sources. Landfill
INFLUX observational results to date: Ground-based measurements
Picarro, CRDS sensors; NOAA automated flask samplers; Communications towers ~100 m AGL INFLUX ground-based instrumentation 10 km
In-situ – flask comparisonat 5 INFLUX sites • NOAA 1 hour integrated flask samples • Mean value in-situ - flask: • CO2: 0.09 ppm • CH4: 0.6 ppb • CO: -4.1 ppb • Within WMO recommendations (urban)
Flask results: C14 ICDC9 Poster 224: Turnbull et al.
Tower in-situ results / Mesoscaleatmospheric inversion system
Mesoscale modeling system • WRF-Chem running with: • 3 nested domains (9/3/1 km resolution), inner domain: 87x87 km2 • Meteorological data assimilation • Hestia anthropogenic fluxes for the inner domain • Vulcan anthropogenic fluxes for the outer domains • Carbon Tracker posterior biogenic fluxes • Carbon Tracker boundary conditions • Lagrangian Particle Dispersion Model • Bayesian matrix inversion T. Lauvaux
Inversion system test Gain – relative improvement prior vs. posterior Flux units: gC m-2 hr-1. Very good system performance within the tower array. Very idealized case, but encouraging nonetheless. 1 = perfect correction to prior fluxes
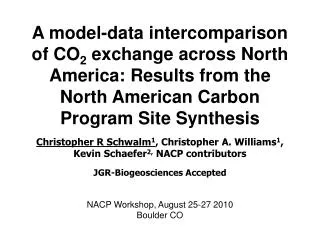
Influence functions: INFLUX • “Influence function” – the areas that contribute to GHG concentrations at measurement points • 12 towers in 87 x 87 km2 domain • Strategy: oversampling (?) Contour: Hestia residential sector
Sectoral atmospheric mole fractions, tower by tower Winter mean mole fractions 6 of 12 tower sites Midday ABL mixing ratio (ppm) Site 1: background Site 2: downwind Site 10: powerplant! Some structure across towers by sector Site 1 Site 10 2 5 9 7 commer indust mobile resid powerplant
Comparison of [CO2] at INFLUX sites • Afternoon [CO2] with 21-day smoothing • Site 03 (downtown): high [CO2] • Site 09 (rural site to the east of the city): low [CO2] • Seasonal and synoptic cycles are evident Site 03: downtown Site 09: rural 2012 * Note: Tower heights range from 40 m AGL to 136 m AGL
Observed range of CO2 amongst INFLUX sites < 3 ppm on 29% of days > 10 ppm on 10% of days
Observed range of CO2 amongst INFLUX sites < 3 ppm on 29% of days > 10 ppm on 10% of days 29% of ranges are < 3 ppm 10% of ranges are > 10 ppm
CO2 range as a function of wind speed Observations: CO2 range amongst INFLUX sites Increased residence time (at low winds) tends to increase the CO2 range
CO2 range as a function of wind speed Observations: CO2 range amongst INFLUX sites Model: Difference along domain-averaged wind direction Increased residence time (at low winds) tends to increase the CO2 range
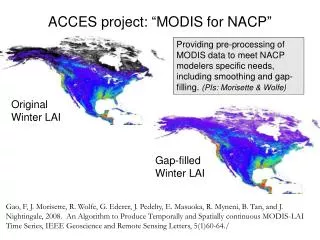
Average [CO2] above background site • Compared to Site 01 (background) • Site 03 (downtown site) measures larger [CO2] by 3 ppm • Site 09 measures only 0.3 ppm larger than Site 01 Average CO2 (ppm) Observations Afternoon hours Downtown site Background site East of city 01 02 03 04 05 07 09 10 12
Average CO2 compared to background site Average CO2 (ppm) • Forward model results: using Hestia 2002 fluxes • Average: obs 25% higher than predicted Background site 01 02 03 04 05 07 09 10 12
Average CO2 compared to background site Average CO2 (ppm) • Forward model results: using Hestia 2002 fluxes • Average: obs 25% higher than predicted Background site 01 02 03 04 05 07 09 10 12
NACP Conclusions • Whole city flux estimates achieved via aircraft mass balance. ~40% uncertainty • Winter, CO2 = CO2ff. Summer, not so. • Tower observations detect a clear urban signal in both CO2 and CH4 (buried amid lots of synoptic “noise”). • Differences vary greatly with weather conditions • Inversion system with 6 towers performs very well under idealized conditions. • “Real data” forward results encouraging.
Vertical profiles of CO2 Rural site October 2012
Vertical profiles of CO2 Downtown site October 2012 Rural site October 2012 • Downtown site, compared to the top level (54 m): • 40 m level is 0.3 ppm higher, averaged over 1 month • 20 m level is 1.7 ppm higher • 10 m level is 4.3 ppmhigher • INFLUX tower heights range from 40 m AGL to 136 m AGL
Sensitivity test: Average [CO2] above background site • Check sensitivity of results to small errors in modeled winds • Hestia fluxes shifted by 1 grid point in each direction • Which sites are more useful for reducing uncertainty? Background site
Sensitivity test: Average [CO2] above background site • Check sensitivity of results to small errors in modeled winds • Hestia fluxes shifted by 1 grid point in each direction • Which sites are more useful for reducing uncertainty? • Differences of 0.5 – 1 ppm at sites 03, 07, and 10 • Lower at other sites Background site