Download
1 / 18
180 likes | 432 Views
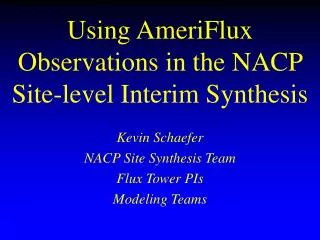
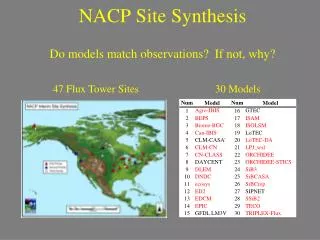
NACP Site Synthesis . 47 Flux Tower Sites. 30 Models. Do models match observations? If not, why?. Presentations. Tuesday Comparison of observed and modeled carbon and energy fluxes for agricultural sites under NACP site-level interim synthesis ( Lokupitiya et al .)

E N D
NACP Site Synthesis 47 Flux Tower Sites 30 Models Do models match observations? If not, why?
Presentations • Tuesday • Comparison of observed and modeled carbon and energy fluxes for agricultural sites under NACP site-level interim synthesis (Lokupitiya et al.) • Using AmeriFlux Observations in the NACP Site-Level Interim Synthesis (Schaefer et al.) • Comparing Simulated and Observed Gross Primary Productivity (Schaefer et al.) • Sensitivity of modeled carbon pools and fluxes to biases in reanalysis meteorology forcing data (Ricciuto et al.) • Wednesday • How much model complexity is necessary to accurately predict peatland CO2 fluxes? (Sulman et al.) • Evaluation of Site and Continental Terrestrial Carbon Cycle Simulations with North American Flux Tower Observations (Raczka and Davis) • Impact of data assimilation on terrestrial carbon cycle model performance from site to regional scales (Ricciuto et al.) • Evaluating Terrestrial Biosphere Models: Comparing Simulated and Observed Net Ecosystem Exchange (Schwalm et al.) • Results from the NACP Site-Level Interim Synthesis (Schaefer et al.) • Thursday • A Modeling and Synthesis Thematic Data Center for the North American Carbon Program (Cook et al.)
NACP Interim Synthesis: Regional and Continental Models and Observations Objective: a synthesis of results from a broad range of investigations: state of our understanding of the carbon balance of North America Approach: collecting “off the shelf” data from various regional / continental-scale results: inverse models, terrestrial biosphere (‘forward’) models, inventories and observations (including remotely-sensed data sets)
NACP Interim Synthesis: Regional and Continental Models and Observations • Presentations: • McGuire, 4:45p Thursday • Post, 8:30a Friday • Tian, 9:50 Friday • Posters: • Huntzinger, F-124 • MsTMIP, F-125 • Raczka, F-130 • Cook, H-176 • NACP: “State of the Science in Assessing the North American Carbon Budget” I & II
Atmospheric Inversions CO2 CO2 CO2 CO2 CO2 CO2 C C Inventories Mid-Continent Intensive Synthesis Lead: Stephen M. Ogle Natural Resources Ecology Laboratory, Colorado State University
MCI Campaign Region Pre-Campaign Atmospheric Measurement Network Campaign Atmospheric Measurement Network
Inventory Posters H-184: MCI Inventory Overview, Ogle F-129: Cropland Inventory Evaluation, Ogle G-167: US Cropland Carbon Budget, West H-172: Crop NPP, Bandaru H-170: Assessing US Carbon Budget, Zhu G-160: Verifying US Soil C Inventory, Spencer Oral Presentation 9:50AM, Thursday, Fossil Fuel Emissions Uncertainty, Gurney
Atmospheric Inversions Oral Presentation 4PM, Thursday – Overview of Inversions, Schuh 4:15PM, Wednesday – Impact of expanding network on atmospheric inversions, Mueller Posters E-119: Transport Model Comparison, Andrews H-182: Network Design for High Resolution Inversions, Lauvaux
Reconciling Inventory & Inversion Inventory Inversion Inversion Inventory Oral Presentation 4:45PM, Wednesday – Comparing, Attributing and Reconciling Inversion and Inventory Estimates, Cooley
OBJECTIVE 1: Provide reliable information on the spatial and temporal extent of forest disturbances and the severity of these disturbances WORKING GROUP 1: QUANTIFYING FOREST DISTURBANCES OBJECTIVE 2: Quantify the impacts of disturbance on processes controlling carbon cycling in forests WORKING GROUP 2: IMPACTS OF FOREST DISTURBANCE OBJECTIVE 3: Quantify the impacts of other disturbances and longer-term climate change on the terrestrial carbon budget of North America WORKING GROUP 4: WOODY ENCROACHMENT AND HNL SOILS ULTIMATE GOAL: To quantify the short and long-term impacts of disturbance and climate change on the terrestrial carbon budget of North America WORKING GROUP 3: MODELING OF THE IMPACTS OF DISTURBANCE
Disturbance Synthesis Presentations • Tues 11 am - What have we learned from forest tower flux data following disturbance? – Amiro et al. • Wed 11 am posters #W-221: Carbon emissions from North American wildland fires: a review of methods and comparison of results from five case studies – French et al. #E-102: Recent Rates of Forest Harvest and Conversion in North America - Jeff Masek et al. #D-94: Observations and assessment of forest carbon recovery following disturbance in North America - Goetz et al. • Wed 4 pm - The impacts of biotic disturbances on carbon budgets of North American forests – Hicke et al. • Wed 4:15 pm - Vulnerability of high latitude soil carbon in North America to disturbance – Grosse et al. • Wed. 5 p.m. - Impacts of Disturbance on the North American Carbon Budget - a Synthesis - Kasischke et al.
Coastal Carbon Interim Synthesis Activity • Five regional preliminary budgets • East Coast and Gulf of Maine – Wei-jun Cai • Gulf of Mexico – Paula Coble • Great Lakes – Galen McKinley • Arctic – Jeremy Mathis • West Coast – Simone Alin • Initiated at July 2008 OCB Meeting • Presentations given in special sessions at the 2009 and 2010 OCB Meeting. • Science meeting held in 2010 before AGU. • In 2011, work will continue with smaller meetings for each region. • Science meeting associated with the 2012 OCB meeting.
Fluxes of Interest • Inputs from land of DOC, POC, and DIC • Air-sea: Exchange of CO2, rainwater DOC • Sedimentary fluxes: POC deposition, DOC & DIC exchange, benthic productivity, groundwater, hydrocarbon seeps • Shelf-break exchange: DIC, DOC, POC Interfacial fluxes: Internal fluxes: • Primary production • Respiration • Net community production Poster Session III – Wed.11 AM - 12 PM (Side Meeting 5:15 – 6:15, Conti) C-64: Lake Superior's influence on regional carbon budgets (McKinley et al.) C-65: Coastal Carbon Fluxes along the U.S. Eastern Continental Shelf Derived from a Coupled Biogeochemical-Circulation Model (Friedrichs et al.) D-74: Carbon System Dynamics in the Large River-Dominated Northern Gulf of Mexico Coastal Margin (Lohrenz et al.)
NACP non-CO2 GHG Synthesis Project • OVERVIEW • Goal: synthesis of data and models to define the spatial/temporal distributions and sources of CH4, CO2 and N2O over N. America. • Archive data for concentrations, and a priori source fields. • Determine regional/continental sources
Participants (partial list) • Graduate students &c • Archana Dayalu • Scot Miller • Leland Werden • Undergraduates: • Talya Havice • Max Brondfield • Others: • MAST DC &c • Steve Wofsy (chair) • Arlyn E. Andrews • Colm Sweeney • Doug Worthy • Hanqin Tian • Anna Michalak • Dale Hurst • Adam Hirsch • Bill Munger
DATABASE • Additional data sets—password protected • DLEM (2000-2008); simulated daily flux values for N20 and CH4 across North America • NOAA Aircraft (2000-2008); PFP data from vertical profiles at NOAA tower sites, measuring CH4, N2O, CO, SF6, and CO2. (internal only) ** • TCCON (2004-2009); continuous data for CO2 only. O2, CH4, N2O, CO, H2O, and HDO data awaiting calibrations. (on password protected site) • NOAA Tall Towers Data Sets (~2000-2009); Programmable Flask Packages (PFP) data, (awaiting final level QC.)** • Data sets expected to become available: • ARCTAS (2008); CA Central Valley; CLASSIC (2007) • WMO Environment Canada Flights (2003-2005) • NACP MCI; START-08; TexAQS Comprehensive; uniform, accessible format. http://nacp.ornl.gov/int_synth_greenhouse.shtml • MAST-DC website (ORNL)—public • AGAGE (2000-2008); continuous CFCs, HFCs, HCFCs, CH4, N2O, SF6... ** • CSIRO Gaslab (2000-2001); flask data for CH4, CO2, CO and H2 • COBRA (2003 & 2004); C & F data: CO2, CO, CH4, N2O, CFCs, CH3CCl3, CCl4, SF6, O3. • WMO/Environment Canada(2000-2008); C & F data for CH4, CO, CO2. (SF6, N2O,H2) • INTEX A&B (2004&2006); C&F data for numerous gases and aerosols • Irvine Latitude Network (2000-2004); F data methane, NMHCs, alkyl nitrates, and chlorinated carbon compounds. • NOAA (2000-early 2009); C & F data for halocarbons, trace gases, CFCs , N2O, CH4, CO2, H2, 13C and 18O isotopes • SCRIPPS (2000-2001); Flask data for CO2 • Tyler UCI (2000-2001); Flask data for CO, CH4, and their isotopes.
Related Posters and Talks at NACP • Local signals of CO2, CH4 and N2O in the San Francisco and Sacramento regions of California. – • Modeling greenhouse gas balance induced by nitrogen addition in terrestrial ecosystems of the United States • The GHG Balance of Terrestrial Ecosystems in North America in the early 2010s: Magnitude and Attribution • Novel approaches to estimating regional CH4 fluxes from a very tall tower • Comparison of Global Inundated Wetland Products Generated Through Multiple Resolution Microwave Remote Sensing Data Sets • Methane emission from natural wetlands in northern mid-high latitude since 1980s • Spectroscopic analysis and assessment of the critical role of geologic greenhouse gases from fossil fuel fugitive methane emissions towards global warming • Biomass Burning Emissions of Methane - Source Sensitivity to Algorithm Assumptions • Episodic CH4 emissions from a temperate fen • Comparison of a priori-based and geostatistical inverse methods for estimating methane emissions from Central California
Summary of model results: • Time series from WLEF (US Midwest) and Fraserdale (Hudson Bay Lowlands), COBRA aircraft data: using a high resolution Lagrangian Particle Dispersion Model ("STILT") • N2O – Bayesian and geostatistical inverse analysis both give excellent simulations of observed time series. Results confirm the prevalence of agricultural sources, define the season cycle. Emissions larger than most bottom-up. • CH4 – Confirm excellent simulation of time series at tall towers, and demonstrate the importance of regional wetlands and surprisingly strong industrial emissions. • Annual budgets and error estimates determined for CH4 and N2O in the US.