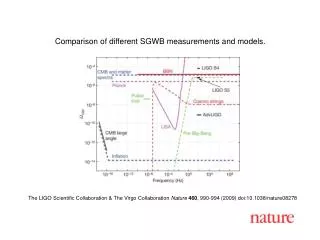
Download
1 / 1
20 likes | 157 Views
Comparison of Orbscan and Ultrasound Pachymetry Measurements. Faik Orucov, MD , Abraham Solomon, MD, Ziv Caspi , David Landau, MD, Eyal Strassman, MD, and Joseph Frucht-Pery, MD.

E N D
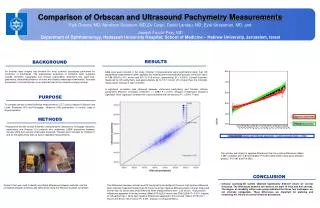
Comparison of Orbscan and Ultrasound Pachymetry Measurements Faik Orucov, MD, Abraham Solomon, MD,Ziv Caspi, David Landau, MD, Eyal Strassman, MD, and Joseph Frucht-Pery, MD Department of Ophthalmology, Hadassah University Hospital; School of Medicine – Hebrew University, Jerusalem, Israel RESULTS BACKGROUND An excimer laser surgery has become the most common procedures performed for correction of ametropias. The preoperative evaluation of refractive laser surgeries include; refraction, topography and orbscan examination, Schirmer’s test, pupil size, pachimetry, intraocular pressure, slit lump and dilated fundoscopic examination. Accurate assesment of corneal thicness is an important part of the refractive surgery workup. 6466 eyes were included in the study. Orbscan II measurements were significantly higher than US pachymetry measurements when applying the manufacturer-recommended acoustic correction factor of 0.96 (553.8 ± 41.2 micron and 531.7± 31.6 micron, respectively) (P < 0.0001). Corneal thickness measured by US pachymetry was approximately 22.1± 19.7 microm (4%) higher than the thickness measured by Orbscan II with correction. A significant correlation was observed between ultrasound pachymetry and Orbscan slitscan pachymetry (Pearson correlation coefficient, r = 0.887; P < 0.001). Analysis of regression showed a significant linear regression between the values obtained with the devices (P < 0.0001, F test). PURPOSE To compare central corneal thickness measurements (CCT) using Orbscan II (Bausch and Lomb, Rochester, NY) and Sonogage ultrasonic (US) pachymetry in normal eyes of large population. Ultrasonic pachymetry METHODS Orbscan pacymetry Preoperative central corneal thickness measurements obtained by Sonogage ultrasonic pachymetry and Orbscan II in patients who underwent LASIK procedures between January 2002 and January 2006 were analyzed. Thinnest point included for Orbscan II and for US pachymetry after at least 3 repeated measurements. Ultrasonic pachymetry and Orbscan pacymetry ( custom acoustic factor = 0.96 ) The cylinder was higher in negative differences than the positive differences (Mean -1.26±1.4 diopter and -0.87±0.9 diopter; P<0.001) while simK’s were same between groups ( P=0.491 and P=0.585 ). CONCLUSION • Orbscan scanning-slit system obtained significantly different values for corneal thickness. The differences between two devices are more in thick and thin corneas. The degree of variability within each group indicated that these two techniques are not clinically comparable. These differences are important for planning and measuring the effects of corneal refractive procedures. Student t test was used to identify significant differences between methods, and the correlation between methods was determined using the Pearson bivariate correlation. The differences between orbscan and US pachymetry are divided to three as, high positive difference when orbscan measured thicker than 22 micron and high negative difference when orbscan measured thinner than 22 micron and small difference when measurements were ± 22 micron. High positive differences appeared in thicker corneas (Mean 575.4±32.4 micron and 538.2±29.4; P< 0.001, orbscan vs US pachymetry ) while high negative differences appeared in thin corneas ( Mean 477,9± 44.1 micron and 514.1± 45.4 micron; P< 0.001, orbscan vs US pachymetry ).