Download
1 / 33
330 likes | 353 Views
This research discusses the comparison of inertial profiler, leveling, and 3D laser scanning methods for road measurements, aiming to establish a certification test site, evaluate repeatability and accuracy, and develop certification guidelines. The study includes a detailed overview of each method, field data collection processes, observations, and future work suggestions. Various aspects such as pavement texture analysis, roughness, and aggregate size are considered. The advantages and disadvantages of laser scanning are highlighted, along with the workflow and data processing involved. The research also presents comparisons of data obtained from different methods and outlines questions for further investigation and potential future work.

E N D
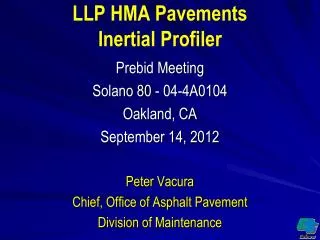
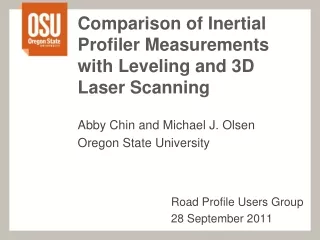
Comparison of Inertial Profiler Measurements with Leveling and 3D Laser Scanning Abby Chin and Michael J. Olsen Oregon State University Road Profile Users Group 28 September 2011
Outline • Research Objectives & Plan • 3D Laser Scanning • Field Data • Observations & Future Work
Research Objectives • Establish certification test site • Determine repeatability and accuracy of reference profiler (inclinometer) • Develop procedures and guidelines for certification of inertial profilers
Background • ODOT is implementing IRI-based incentive/disincentive program • Certification on site proved difficult • Inertial profilers were showing great repeatability, but did not meet AASHTO criteria
Research Plan • Compare Methods • Inertial Profiler • Terrestrial LiDAR • Rod and Level • Inclinometer Profilers • Develop Certification Procedure Guidelines • Pavement Texture Analysis • Study Roughness and Aggregate Size
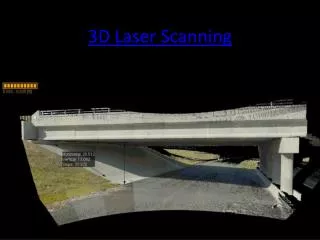
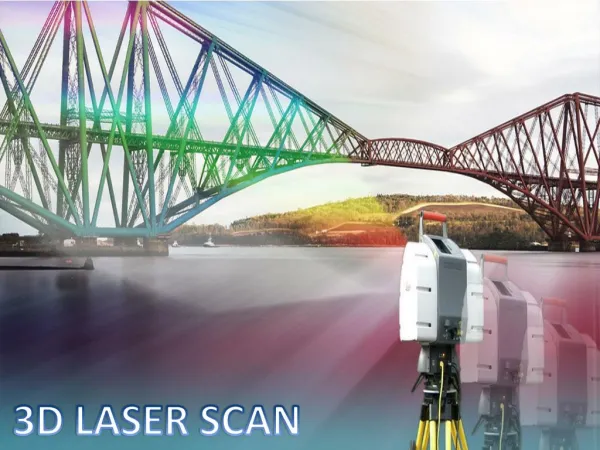
What is LiDAR? LiDAR = Light Detection and Ranging Dt D • D = 0.5cDt • c = speed of light • Dt = travel time Original Slide by: Evon Silvia - Oregon State University
Terrestrial LiDAR • Time of Flight System • Produces 3D Point Cloud • ~5 mm Accuracy at 50 m • Data are Geo-referenced • Targets • GPS
Equipment GPS Camera Scanner Computer Power Source
Data • Point Cloud • X Y Z coordinates • R G B color mapped • Intensity value (return signal strength) • 3D model
Laser Scanning Advantages • Multiple Profiles • Redundant Data • Dense Point Cloud (1-5 cm Spacing) • Quick Data Acquisition • Improved Safety • Road Open to Traffic • Identify Localized Depressions • Continual Evaluation • As Built Survey Data
Laser Scanning Disadvantages • Individual measurements accurate to +/- 5mm • Objects can block line of sight • Field setup time • Data processing requires training and time
Mobile Laser Scan System Laser scanner GPS receiver Camera
Field Test Setup • 528 ft Section • 6 Scan Positions • Every 50 m • GPS used to determine position • 5 Targets • Every 50 m • Total station used to determine position
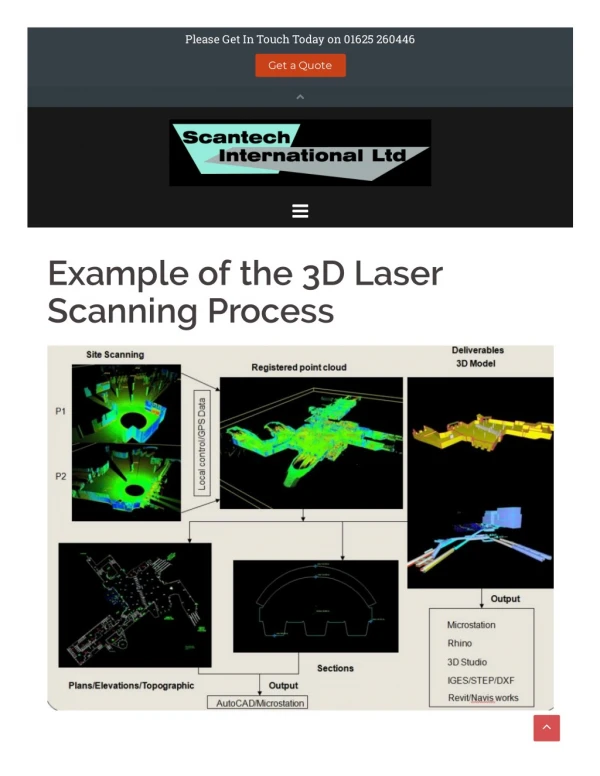
Field Data - Workflow • Obtain 3D point cloud • Prune data to roadway • Statistically filter data to specified spacing • Obtain profile using GIS • Input data in ProVAL
Statistical FilteringProcess http://www.lidarnews.com/content/view/8378/136/
IRI Comparisons • Inclinometer Profiler • Left – 66 in/mi • Right – 84 in/mi • Laser Scanner • Left – 73 in/mi • Right – 88 in/mi
ProVAL Data – Left Wheel Path Scanner Inclinometer
ProVAL Data – Right Wheel Path Scanner Inclinometer
Observations • Data between inclinometer profiler and laser scanner is offset • Offset gets larger • Laser scan data filtered to 1 ft intervals • Visible noise in the data • Starting points may not be exactly the same
Laser Scan Data Comparison - Worst 1 ft Spacing 0.25 ft Spacing Grid Cell Dimensions2” V x 20’ H 0.5 ft Spacing
Laser Scan Data Comparison - Best 1 ft Spacing 0.25 ft Spacing Grid Cell Dimensions2” V x 20’ H 0.5 ft Spacing
Localized Depressions Middle Section Right End 29
Questions to Investigate 30 • Laser Scanning • Can the noise be smoothed out while taking advantage of the dense data? • i.e. close point spacing • Compare the profiles in ProVAL • Are IRI values consistent? • Do the distance vs. elevation plots agree? • What are the reasons for any discrepancies?
Future Work • Obtain and compare additional profiles from test site • Laser Scanning • Inertial Profiler • Rod & Level • Create procedures and guidelines for certification