Global Fingerprint of Climate Change Impacts in Natural Systems
This study explores the coherent impacts of climate change across natural systems, providing key conclusions and observed changes in physical and ecological systems. It discusses the risks of large-scale discontinuities, distribution of impacts, and the increase in global mean temperature post-1990. The research draws on various studies, including biotic and physical changes, to highlight the interconnection between climate change predictions and observed effects on diverse species. The study also delves into the climatic connections affecting species like the Edith's checkerspot butterfly in the USA.

Global Fingerprint of Climate Change Impacts in Natural Systems
E N D
Presentation Transcript
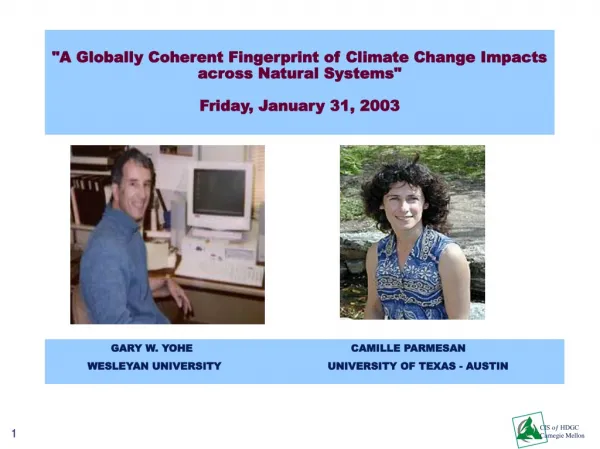
"A Globally Coherent Fingerprint of Climate Change Impacts across Natural Systems" Friday, January 31, 2003 GARY W. YOHE CAMILLE PARMESAN WESLEYAN UNIVERSITY UNIVERSITY OF TEXAS - AUSTIN
CIS oƒ HDGC Carnegie Mellon A Globally Coherent Fingerprint of Climate Change Impacts across Natural Systems Camille Parmesan & Gary Yohe January 31, 2003 Center for Integrated Study of the Human Dimensions of Global Change,
IPCC and Degrees of Confidence Quantitative Scale: • 95% or greater Very High Confidence • 67-95% High Confidence • 33-67% Medium Confidence • 5 – 33% Low Confidence • Less than 5% Very Low Confidence
IPCC and Degrees of Confidence Qualitative Scale: Well Established – Lots of evidence; high consensus Established but Incomplete – high consensus on limited information Competing Explanations – Lots of evidence; alternative explanations Speculative – Little evidence and many plausible explanations
The IPCC Dynamic “We have very high confidence that X might happen!” “We have medium to low confidence that X will happen!” Converged to the notion that the statements should speak to the “will” alternative for a baseline.
Observed Changes in Physical and Ecological Systems (from IPCC 2001) hydrology / sea ice animals plants study covers study based on glaciers large area remote sensing
Key Conclusions from IPCC Recent Regional Climate Changes, particularly Temperature Increases, have Already Affected Many Physical and Biological Systems (high confidence, or >67% sure) Biotic change: 44 regional studies, 400 plants and animals, 20 to 50 years Physical change: 16 regional studies, 100 processes, 20-150 yrs • non-polar glacier retreat • reduction in Arctic sea ice extent and thickness in summer • earlier plant flowering and longer growing season in Europe • poleward and upward (elevation) migration of plants, insects and animals • earlier bird arrival and egg laying • increased incidence of coral bleaching • increased economic losses due to extreme weather events
Past Future Figure 19-8-1: Summary of Lines of Evidence Risks of large scale discontinuities Very low Higher Positive or Negative Monetary; Most People Adversely Affected Aggregate impacts Net Negative in All Metrics O b s e r v a t i o n s Negative for some regions Negative formost regions Distribution of impacts Risk of extreme weather events Increase Large increase Risks to unique & threatened systems Risks to Some Risks to Many -0.7 0 1 2 3 4 5 Increase in Global Mean Temperature after 1990 (°C)
The “Global Fingerprint” was a “Reason for Concern” The degree of confidence issue was contentious. Lisbon authors’ meeting: Chapter 2 – Tools discussion – how to judge? Chapter 5 – Ecosystems – Of course this is “very high” Confidence Chapter 19 – Include in the burning ember, but with confidence “medium” at best or “very high” ???
A Schematic Portrait of the Problem Study 1 Study 2 ……………… Study n Climate Climate Climate Change Change Change Impact Impact Impact Non- Non- Non- Climatic Climatic Climatic Factors Factors Factors
A Thought Exercise Let there be n separate studies. Let n’ produce results that are contrarian with respect to predicted climate impacts. Let p be the probability that there are explanations that compete with climate in any single study. Let pi be the likelihood that climate was corrected attributed as the cause in any study.
Complications • Common Drivers of Non-climatic Drivers – Raises the contours. • Studies that Show Sign Changes – Lowers the contours. • Publication Bias against Contrary or Insignificant results – Increases the (n’/n) ratio.
New Analyses of changes from literature • Studies with > 20 years data • Primarily multi-species - Counteracts publishing bias highlighting only species which show significant change • Mostly multi-site (moderate to large geographic coverage) • Conducted in nature reserve or rural natural area - minimizes chances of confounding factors (brings p closer to 1)
Biotic Changes are Systematically in accord with Climate Change Predictions Diverse species of: trees, herbs, shrubs, reptiles, amphibians, fish, marine zooplankton & invertebrates, mammals, birds butterflies (Parmesan & Yohe, Nature 2003)
52° N 48° N 44° N 40° N 36° N % extinctions > 70 % 32° N 35 - 55 % < 20 % Edith’s Checkerspot butterfly:Patterns of Population Extinctions in natural areas (good habitat)
Climatic Connections: USA • 0.7º C warming over Western USA climatic shift of 105 km North & 105 m up (Karl et al. 1996) E. editha: mean location shifted 92 km North & 124 m up (Parmesan 1996) • Both snowpack & E. editha extinction trendsshift at 2400 m: % snow/50 yrs % extinctions • Below 2400 m14 % less snowpack ; melt 7 d earlier 46 % • Above 2400 m 8 % more snowpack ; no melt 14 % (T. Johnson, 1998)
Ehrlich, Evolution ‘65 Singer, Ph.D. dissertation Stanford ‘71 Singer, Science ‘72, Singer & Ehrlich, Fortschritte der Zoologie ‘79 Ehrlich et al., Oecologia ‘80 White & Levin, Amer. Midland Natur. ‘80 MacKay Ecology ‘85 MacKay, Res. Pop. Ecol. ‘85 Singer, Evolution ‘83 Murphy & White, Pan. Pacific Entomol. ‘84 Dobkin et al., Oecologia ‘87 Weiss et al, Oikos ‘87 Weiss et al, Ecology ‘88 Moore, Ecology ‘89 Parmesan, Ph.D dissertation ‘95 Boughton, Ecology ‘99 Boughton, Ph.D dissertation ‘99 Weiss et al, Oecologia ‘93 Foley et al., Singer & Thomas, American Naturalist ‘96 Thomas et al., American Naturalist ‘96 Parmesan, Nature ‘96 Hellman, book ch. Fleishman et al. J. Res. Lep. Singer, in press McLaughlin et al. 2000 Climate and E. editha : literature
ATTRIBUTION by INFERENCE Example: Euphydras editha butterfly • Correlational Patterns • Long-term patterns (100 years) --- range shift matches temperature isotherm shift and matches patterns of snowpack dynamics (Parmesan 1996, Karl et al. 1996, Johnson 1998) • “natural experiments” (40 years) --- below 2400 m, population extinctions occur in drought years and following false springs (light snowpack). Above 2400m, booms occur with heavy snowpack (Singer & Ehrlich 1979, Singer & Thomas 1996, McLaughlin et al. 2002) • Field Manipulations • manipulating thermal environment (slope aspect, habitat type) affects larval growth rates, pupal times, synchrony with host plant, and colonization success (Singer 1972, Weiss et al. 1988, 1993,, Boughton 1999) • Laboratory Experiments • temperature increases larval growth rates (Weiss et al 1988, Hellmann 2000)
Thought Exercise revisited p = Probability of competing explanations (confounding factors) π = Probability that observed change is really due to climate (mechanistic link) n’/n = Proportion of species going in opposite direction to climate change predictions Binomial probability model with each factor varying from 0 to 1 Here, p=0
Diagnostic Biological Fingerprint • Temporal - Advancement of timing or northward expansion in warm decades (1930s/40s & 1980s/'90s) - Delay of timing or southward contraction in cool decades (1950s/'60s) • Spatial Different behaviors at extremes of range boundary during particular climate phase, e.g. expansion at northern range boundary simultaneous with contraction at southern range boundary during warming period • Community Abundance changes have gone in opposite directions for cold-adapted vs. warm-adapted species. e.g. lowland birds increasing and montane birds decreasing at mid-elevation site.
Diagnostic Biological Fingerprint • “Sign-Switching” found for 294 species • 80% of abundance shifts in communities • 100% follow decadal trends in temperatures (up & down) • 100% show geographic contraction at equatorial boundary coupled with expansion at poleward boundary of species range • Increases confidence from either perspective (Parmesan & Yohe 2003)
Conclusions • We havehigh to very highconfidence that regional climate changes (resulting from global warming) have had impacts on wild species • Observed changes are typically small in magnitude, but are likely to be an important factor in long-term persistence of species and stability of ecosystems
More Conclusions from a Skeptical Perspective • The thought exercise allows an approach that accommodates maximum skepticism. • Even then, the Medium Confidence can be claimed. • Indeed, Schneider’s “more likely than not” benchmark is satisfied. • Adding sign-switching adds to the power and moves even a skeptical interpretation in the High Confidence range.