Download
1 / 2
40 likes | 339 Views
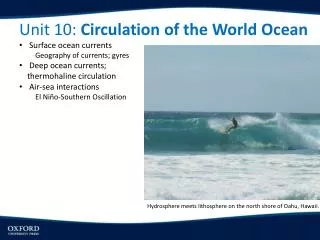
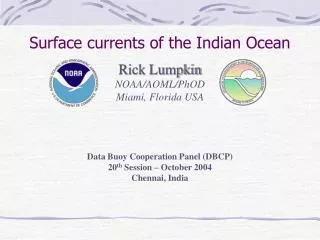
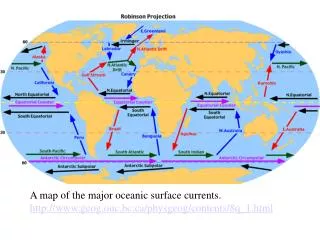
A map of the major oceanic surface currents. http://www.geog.ouc.bc.ca/physgeog/contents/8q_1.html.

E N D
A map of the major oceanic surface currents. http://www.geog.ouc.bc.ca/physgeog/contents/8q_1.html
El Niño Continues to Grow: Pacific Ocean Shows Higher Than Normal Sea Surface Heights December 02, 2002 The latest image from NASA's Jason oceanography satellite, taken during a 10-day collection cycle ending December 2, 2002, shows the Pacific dominated by two significant areas of higher-than-normal sea level (warmer ocean temperatures). In the central equatorial Pacific, the large area of higher than normal sea surface heights (warmer than normal sea surface temperatures) associated with growing El Niño conditions has recently migrated eastward toward the coast of South America. Meanwhile, the influence of the 20- to 30-year larger than El Niño/La Niña pattern called the Pacific Decadal Oscillation continues to create warm, higher-than-normal sea-surface heights in the north Pacific that are connected in a warm horseshoe pattern with the western and southern Pacific.http://topex-www.jpl.nasa.gov/elnino/20021202.html