Download
1 / 14
190 likes | 594 Views
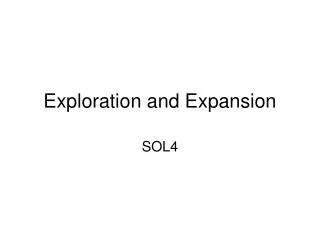
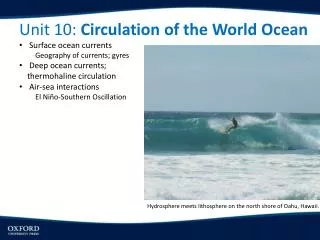
Unit 10: Circulation of the World Ocean Surface ocean currents Geography of currents; gyres Deep o cean currents; thermohaline circulation Air-sea interactions El Niño-Southern Oscillation. Hydrosphere meets lithosphere on the north shore of Oahu, Hawaii. . OBJECTIVES

E N D
Unit 10: Circulation of the World Ocean • Surface ocean currents • Geography of currents; gyres • Deep ocean currents; • thermohaline circulation • Air-sea interactions • El Niño-Southern Oscillation Hydrosphere meets lithosphere on the north shore of Oahu, Hawaii.
OBJECTIVES • Relate the surface ocean circulation to the general circulation of the atmosphere • Describe the major currents that constitute the surface ocean circulation • Demonstrate the role of the ocean circulation in the transport of heat at Earth’s surface • Explore the significant water currents that occur below the surface layer of the sea. • Examine El Niño, the periodic, large scale abnormal warming of the sea surface in low latitudes of the Pacific Ocean.
Air-sea interactions: how the atmosphere and ocean influence each other • Heat transfer • Water transfer-evaporation, precipitation • Momentum transfer-winds create surface currents Source: https://www.meted.ucar.edu/training_module.php?id=534
Heat Transfer Typical temperature profiles illustrating the mixed layer, thermocline, and deep ocean layers in tropical, midlatitude, and polar oceans.
This sea-surface temperature image of the western North Atlantic Ocean shows a warm current, the Gulf Stream, as it skirts the North American coast from Florida to North Carolina. It flows northeastward into the open ocean and becomes the less clearly defined North Atlantic Drift. This drift cools as it moves into the North Atlantic, yet the warmth that is carried north- and northeastward into the middle latitudes has a major influence on atmospheric environments in Western Europe. A cold current, the Labrador Current, is evident flowing south, and is wedged between the Gulf Stream and the northeast United States. The color chart at right indicates approximate temperatures in degrees Celsius. Source: http://en.wikipedia.org/wiki/Gulf_Stream
Source: Perpetual Ocean http://www.youtube.com/watch?v=CCmTY0PKGDs Ocean surface currents in the western North Atlantic Ocean in August 2005. The Gulf Stream follows a narrow continuous path until North Carolina, where it begins to meander more actively, ultimately turning into the more diffuse northeasterly trending North Atlantic Drift. Multiple warm core and cold core eddies are evident in the animation.
Surface currents and gyres Generalized pattern of currents in a typical ocean basin, showing the major circulation cells (gyres) and their influencing wind systems. Warm currents are shown in red; cold currents in blue. Note that the Northern Hemisphere differs from the Southern Hemisphere because of the variation in continental landmass configurations.
Ekman Transport Schematic view showing how currents along a north-south trending coast generate upwelling through Ekman transport. Winds are equatorward in both cases. The Coriolis Force deflects ocean movements to right (NH) and left (SH) of the wind at progressively larger angles with increasing depth. For the top 100m the net transport is at a 90o angle, which means westward in both hemispheres.
Upwelling and Productivity Global chlorophyll concentrations averaged over a nine-year period from 1997-2006 as measured by the SeaWiFS satellite sensor. Highest chlorophyll concentrations (in yellow) are found in upwelling zones; areas of moderate chlorophyll concentration (light blue) correspond to regions of strong surface winds or sheer zones between opposing surface ocean currents; dark blue shows areas of very limited ocean productivity, and correspond to subtropical high pressure cells.
Fig 11.6 World distribution of surface ocean currents, showing average positions and relative temperatures in each of the ocean basins.
The Thermohaline Circulation Fig 11.7 A global conveyor belt is often used as a conceptual model to illustrate how the largely wind-driven surface ocean currents are linked to the largely density-driven deep ocean currents. The mixed layer features shallow, narrow, and relatively fast-moving horizontal currents, while the deep ocean currents move as slow, diffuse surges with both horizontal and vertical movement.
El Niño-Southern Oscillation El Niño (the child) occurs near Christmas most every year, a warmer current that shuts down upwelling near Equador, Peru. The El Niño event that effects global weather is a region-wide warming of the central and eastern equitorial Pacific. This is associated with the Southern Oscillation, a pattern of opposite rising and falling pressure in the tropical western and eastern Pacific. These pressure changes cause the trade winds to weaken (El Niño) or strengthen (La Niña). Source: http://www.elnino.noaa.gov/ Ocean-atmosphere coupling and atmospheric interaction in the Equatorial Pacific Ocean during the normal or standard pattern (top), El Niño (cold) phase (middle), and La Niña (warm) phase of the ENSO Index.
The Pacific Decadal Oscillation Warm phase Cold phase The cold phase (blue) dominated the years 1948-1977, while the warm phase (red) dominated 1978-1998, when more El Ninos occurred and southern states were generally wet. Source: http://jisao.washington.edu/pdo/