Download
1 / 17
170 likes | 332 Views
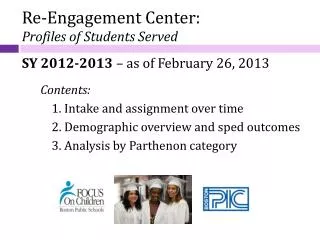
Re-Engagement Center: Profiles of Students Served SY 2012-2013 – as of February 26, 2013. Contents: 1. Intake and assignment over time 2. Demographic overview and sped outcomes 3. Analysis by Parthenon category. 723 students have completed initial intake.

E N D
Re-Engagement Center:Profiles of Students ServedSY 2012-2013 – as of February 26, 2013 Contents: 1. Intake and assignment over time 2. Demographic overview and sped outcomes 3. Analysis by Parthenon category
723 students have completed initial intake. About 900 different students came to the REC from January 2012 to January 2013. 723 came between April 2012 and February 2013 for SY ‘12-’13 services and are thus on this year’s spreadsheet. Those 723 form the basis of the analysis that follows.
46% of all intakes have been assigned to date. By the end of February, 331 had been assigned; 382 had not. This 46% rate compares to 53% by the end of last school year. Less than half of this year’s 54% unassigned are “incompletes”.
FRC drops and assignments, like intakes, peak in Sept. Intake of enrolled students peaks in June and Sept; unenrolled students in Aug and Sept. FRC drops peak in Aug and Sept; assignments or re-assignments in Sept and Oct.
Where students are assigned follows a seasonal pattern. Assignments were mostly to Educational Options programs in early summer. Assignments were mostly to District schools in August. Assignments to REC picked up in September and afterwards.
From intake to assignment took a month or lessfor half of the students assigned this year. But the entire process can take much longer for others.
Students completing intake tend to be black, female. There is currently a greater proportion of females than males served. While this may even out towards the end of the year, it is unlike previous years’ parity. Young students are cause. The smaller proportion of Latinos overall is also unlike previous years.
19% of students completing intake had a sped code. Like last year, Q4, L4, and A4 were the most common codes (besides R2 and R3). This proportion is in line with the district as a whole, with the alpha list of dropouts, and with last year’s REC population.
40% of students with sped codes have been assigned (compared to 46% of students without codes). Students with sped codes represent 19% of all intakes and 16% of all assigned students. Disaggregating by code shows that .4s are less likely than average to be assigned. For assignment by specific program, see Appendix A.
Students with sped codes are older than those without. REC students without sped codes are 18.5 years old on average; 18 as median. REC students with sped codes are 18.9 years old on average; 19 as median. This year, L4s and Q4s especially tend to be older. 67% of sped students are “old and far”, meaning the majority is over 18 and underaccredited for that age.
Parthenon categories: shorthand for age and credits Below: A visual summary of Parthenon categories, which describe academic standing and age.
The majority of REC students are old and far. These proportions are roughly the same as last year.
Whether or not a student has been assigneddoes not vary much by category. . . Again, a total of 331 have been assigned; 382 have not been. For other differences by Parthenon category, see Appendix B.
. . . but where a student is assigned does vary by category. Old and close students tend to be assigned to REC. Old and far students tend to be assigned to BPS Alt Ed. But the proportion _________going to district and REC have almost doubled since last year. Young and far tend to be assigned to district schools. Young and on track are evenly split.
One third of assigned students are assigned to the REC. The proportion of assigned students assigned to the REC was less than half that at the same time last year.