Accessing and Validating Satellite Data for Ozone and Water Vapor Measurements
This resource discusses data accessibility for satellite measurements like Ozone (O3), Water Vapor (H2O), and temperature profiles from various sources, including HALOE and POAM. It highlights the challenges in downloading extensive data and the need for screening due to data noise in certain altitudes. Best practices for data validation and integration with weather models are discussed, as well as the potential insights from using equivalent latitude for stratospheric measurements. Useful contact information for further assistance is provided.

Accessing and Validating Satellite Data for Ozone and Water Vapor Measurements
E N D
Presentation Transcript
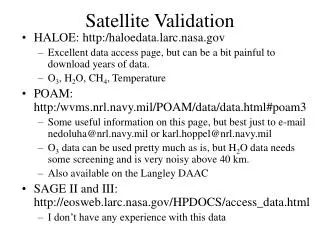
HALOE: http:/haloedata.larc.nasa.gov Excellent data access page, but can be a bit painful to download years of data. O3, H2O, CH4, Temperature POAM: http:/wvms.nrl.navy.mil/POAM/data/data.html#poam3 Some useful information on this page, but best just to e-mail nedoluha@nrl.navy.mil or karl.hoppel@nrl.navy.mil O3 data can be used pretty much as is, but H2O data needs some screening and is very noisy above 40 km. Also available on the Langley DAAC SAGE II and III: http://eosweb.larc.nasa.gov/HPDOCS/access_data.html I don’t have any experience with this data Satellite Validation
Temperature and Pressure Profiles Some satellites provide temperature measurements at some altitudes. HALOE provides measurements above 43 km and merges into NCEP between 34 and 43 km. POAM does not provide any temperature measurements at this time. Should we use satellite temperatures in intercomparisons? Pros: Probably more accurate at time of measurement than anything else available Cons: Timescale of measurement – diurnal variations – pasting together satellite temperature data with other temperature data at upper and/or lower boundaries. Ideally we want to use data from a weather model that goes through the stratosphere and mesosphere, but even if we had such a model Could introduce trends as model is changed and new instruments are added Operational weather models are primarily interested in short-term predictions, not trends Of course, if there really is a trend in temperature and the trend is not included in our model, then it will introduce a trend in our data Satellite Validation 100 mb temperature anomalies 10S-10N
Coincidence criteria Choice of coincidence depends on integration time for microwave instrument Tsou et al. use +/-2o latitude, +/-10o longitude, and 4 hours integration time 4-6 hours For WVMS we use +/-5o latitude, +/-30o longitude, and all data within integration window integration time ~1 week Satellite line of sight generally is ~200 km for ~1 km change in altitude. Doesn’t make sense to set coincidence distance criteria tighter than this Are other, more sophisticated, coincidence criteria useful? Satellite Validation
Trajectories and equivalent latitude Both could be very useful for stratospheric measurements which do not require long integration time. A several day back trajectory to a satellite measurement may work very well. Trajectories may be hard to interpret, since they may go north and south of your site depending upon how far back you look. Equivalent latitude works very well for providing nearly global maps of ozone in the lower stratosphere from solar occultation instruments, so they might be useful for ground-based radiometers. Satellite Validation
Even satellite data from a very limited latitude range (POAM) can cover a large range of equivalent latitudes. Crosses are vortex edge.
Coverage provided by 3 solar occultation instruments using 21 days of ozone measurements.
Some issues related to using equivalent latitude: Reasonably tight correlation between O3 and equivalent latitude up to ~850K (~30km) for O3. Above this chemistry timescales may be too fast for a good correlation. Nevertheless, equivalent latitude will let you know whether the air is coming from the south or the north and will still be qualitatively useful. Water vapor chemistry is slow, but measurement integration times are generally longer and measurement altitudes are higher. Equivalent latitude doesn’t work well if there is vertical motion (mesosphere). Still, I should try it at 40 km. Equivalent latitude may vary with altitude Checked 17000+ POAM NH equivalent latitudes and found that the absolute difference between equivalent latitude at 550K (~21 km) and 750K (~28 km) was >10o for <2400 profiles.
How we might make use of equivalent latitude • Hmm, I have seem to have unusually low ozone values and don’t have any satellite data to check against. • What is the potential temperature where the ozone is low? q=T*(1000 hPa/P)0.288 • Is the equivalent latitude very different from the measurement latitude? Am I inside/outside the vortex? • Vortex edge has a single equivalent latitude for each potential temperature level • Is there a large ozone gradient with respect to latitude? • Check, e.g., UARS climatology monthly means at http://haloedata.larc.nasa.gov/ If you think you might find this useful let me know and I’ll calculate equivalent latitude for a range of q‘s for your site using UKMO data
Water Vapor Mm-wave Spectrometer (WVMS) 22 GHz radiometers using pressure broadening information to make water vapor profile measurements from 40-80 km WVMS measurements are made at 3 sites of the Network for the Detection of Stratospheric Change (NDSC): Lauder, New Zealand (45oS, 169.7oE): Nov. 1992-Apr. 1993 Jan. 1994-present Table Mountain, CA (34.4oN, 242.3oE): May 1993-Nov. 1997, Nov. 2003-present Mauna Loa, HA (19.5oN, 204.4oE): Mar. 1996-present
Coincident (+/-5olat, +/-30olong, ~1 week) WVMS and convolved HALOE measurements at Lauder, New Zealand (45S, 169.7E)
Coincident (+/-5olat, +/-30olong, 1 day) Northern Hemisphere POAM and HALOE measurements. No convolution needed, tighter temporal coincidence.
Coincident WVMS and convolved HALOE measurements at Lauder, New Zealand (45S, 169.7E)
WVMS3 Mauna Loa Averaging kernels for 500 scan integrations from WVMS3 at Mauna Loa, and WVMS1 at Lauder.Note the difference in the sensitivity of the 2 instrumentsAll HALOE data compared with WVMS is convolved with these averaging kernels. WVMS1 Lauder
Coincident WVMS and unconvolved HALOE measurements at Lauder, New Zealand (45S, 169.7E)
Coincident WVMS and convolved HALOE measurements at Mauna Loa, Hawaii (19.5N, 204.4E)
Coincident WVMS and convolved HALOE measurements at Mauna Loa, Hawaii (19.5N, 204.4E)
Coincident WVMS and unconvolved HALOE measurements at Mauna Loa, Hawaii (19.5N, 204.4E)
What could cause a change in the WVMS-HALOE difference? • Calibration problem – but that should affect all altitudes • Pointing problem – but that should affect all altitudes • Baseline issues – should be a problem at 40 km, but not at 50-60 km • Filterbank offset? • Fit for 50 kHz v. 200 kHz at Mauna Loa • Fit for 200 kHz v. 2 MHz at Table Mountain
What could cause a change in the WVMS-HALOE difference? • Calibration problem – but that should affect all altitudes • Pointing problem – but that should affect all altitudes • Baseline issues – should be a problem at 40 km, but not at 50-60 km. • Filterbank offset – Single filterbank results show similar variation relative to HALOE
WVMS2 at Table Mountain now working for the first time since Nov. 1997. Still need to characterize filter shape.
Coincident WVMS and HALOE measurements at Table Mountain, California (34.4N, 242.3E)