Download
1 / 37
380 likes | 400 Views
Learn the fundamentals of quality management, its significance, and how to apply it effectively in projects. Explore key concepts, differences, costs, consequences, and processes to ensure customer satisfaction and project success.

E N D
INTRODUCTION TO QUALITY MANAGEMENT Project Quality Management
A little boy went into a store, reached for a soda carton and pulled it over to the telephone. He climbed onto the carton so that he could reach the buttons on the phone and proceeded to punch in seven digits. The store owner observed and listened to the conversation. The boy asked, "Maam, Can you give me the job of cutting your lawn?" The woman replied, "I already have someone to cut my lawn." "I will cut your lawn for half the price of the person who cuts your lawn now." replied the boy. The woman responded that she was very satisfied with the person who was presently cutting her lawn . The little boy was even more perseverant and said, "I'll even sweep your curb and your sidewalk, so on Sunday you will have the prettiest lawn in all of Palm beach, Florida." Again the woman answered in the negative. With a smile on his face, the little boy replaced the receiver. The store owner, who was listening to this conversation, walked over to the boy and said, "Son I like your attitude; I like that positive spirit and would like to offer you a job."
The little boy replied, "No thanks, I was just checking my performance on the job I already have. I am the one who is working for the lady I was talking to!"
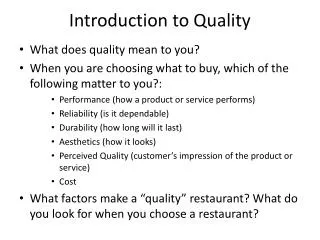
QUALITY MANAGEMENT • WHAT IS MEANT BY QUALITY? • "Quality is the ability of a product or service to consistently meet customer expectations" • "Conformance to requirements" • "Fitness for use" • "Value to some person" • DIFFERENCE Between QUALITY & GRADE ?
Difference between Quality & Grade • Quality is fulfilling the customer requirements and grade is the facilities or features in the product. • "You can choose a low grade product but not the low quality product"
QUALITY MANAGEMENT • DIFFERENCE Between PRECISION & ACCURACY? • MANAGEMENT RESPONSIBILITY • CUSTOMER SATISFACTION WITH NO GOLD PLATING • PREVENTION OVER INSPECTION • CONTUNOUS IMPROVEMENT • MANAGEMENT RESPONSIBILITY • COST OF QUALITY (next screen) • COST OF POOR QUALITY/ NON-CONFORMANCE
COST OF QUALITY/ POOR QUALITY Failure Costs: Costs incurred by defective parts/products or faulty services. Internal Failure Costs: Costs incurred to fix problems that are detected before the product/ service is delivered to the customer. External Failure Costs: All costs incurred to fix problems that are detected after the product/service is delivered to the customer. Appraisal Costs: Costs of activities designed to ensure quality or uncover defects. Prevention Costs: All training, planning, customer assessment, process control, and quality improvement costs to prevent defects from occurring.
CONSEQUENCES OF POOR QUALITY • Loss of business • Liabilities & re-working • Low productivity • Increased inspections • Cost overruns • Disturbed cash flows • Bad market reputation • Disagreements over product acceptances
QUALITY MANAGEMENT WHAT IS QUALITY MANAGEMENT? Quality Management includes the processes required to ensure that project will satisfy the needs for which it was undertaken. Project Quality Management must address both; the management and the product of the project. Failure to either of the dimension can have serious negative consequences for the project stakeholders.
QUALITY MANAGEMENT • There are three (03) processes in this domain: • Plan Quality Management • Perform Quality Assurance • Control Quality
QUALITY MANAGEMENT 1. PLAN QUALITY Management Cost-Benefit Analysis Cost of Quality (Conf. / Non-conf.) Control Charts Benchmarking Design of Experiments Statistical Sampling Flowcharting Proprietary QM Methodologies Additional QM Tools Meetings Scope Baseline
PLAN QUALITY Tools & Techniques: Cost-Benefit Analysiscomparing cost of quality and the expected benefit. Includes less reworks, higher productivity, Lower cost & > S.H. satisfaction Cost of Qualityincludes all costs incurred over the project life to prevent non-conformance to requirements (Seven Basic Quality Tools) Control Chartsare used to determine process stability and predictable performance. Benchmarkingis comparing your planned practices to those of comparable projects. Design of ExperimentStatistical Method should be used during the plan quality process to determine the number and types of tests and their impact on cost of quality. Statistical Samplingis choosing part of population for inspection Flowchartingis graphical relationship of processes in an activity. Proprietary QM Methodologiesinclude renowned tools like Six Sigma, ISOs etc. Additional Quality Planning Toolsinclude brainstorming, matrix diagrams and affinity diagrams etc.
QUALITY MANAGEMENT PLAN • What are the standards that apply on the project • Who would be involved in managing quality, when and what duties • Review of earlier decisions to ensure that they are correct • Quality meetings to be held and when • Reports that will address quality • What metrics would be used to measure quality • What parts of the project or deliverables would be measured and when
QUALITY MANAGEMENT Difference Between QUALITY ASSURANCE AND QUALITY CONTROL QA QC 1. Part of Quality management focused on providing confidence that quality requirements will be fulfilled 2. QA is process oriented 3. QA interprets and strives to achieve customer requirements and project specifications 4. Audits 1. Part of Quality management focused on fulfilling quality requirements 2. QC is product oriented 3. QC helps QA to validate the customer requirements and project specifications 4. Inspections
QUALITY MANAGEMENT 2. PERFORM QUALITY ASSURANCE Plan Quality and Perform Quality Control Tools and Technology Quality Audits: structured, independent process to determine if activities comply with policies and standards Process Analysis Project Management Plan Process Improvement Plan Learning Curve, F. Taylor (m.c)
PERFORM QUALITY ASSURANCE Tools & Techniques: Plan Quality & Quality Control As stated before in Plan Quality and would come in Quality Control later. Quality Audits are structured and independent review to determine whether project activities comply with the ones spelt out in QMP and project policies & processes. Process Analysis is carried out to identify the effectiveness of process and suggest improvement, if required.
QUALITY MANAGEMENT 3. PERFORM QUALITY CONTROL Project Management Plan Quality Metrics Quality Checklists Work Performance measurements Approved Change Requests Deliverables Cause and Effect Diagram Control Charts Flowcharting Histogram Pareto Chart Run Chart Scatter Diagram Statistical Sampling Inspection Approved Change Request review Verified Deliverables
PERFORM QUALITY CONTROL Tools & Techniques: Cause & Effect Diagram Also known as Ishikawa and fishbone diagram. Stated before in Plan Quality and would come in Quality Control later. Control Charts are used to observe process behavior over a period of time and assess that when it is required to be adjusted or replaced. Flowcharting is used to identify the need for potential process improvement opportunities. Histogram is a vertical bar chart showing how often a particular variable state occurred. Pareto Chart is also vertical bar chart that is ordered by the frequency of occurrences. It helps in finding the causes resulting into greatest number of defects. Continued….
PERFORM QUALITY CONTROL Tools & Techniques: Run Chart is a sort of control chart but without boundaries. It shows the history and pattern of a variation. Scatter Diagram shows the relationship between two variables. Statistical Sampling Taking samples to test and observe non conformance. Inspection is examination of product to determine its conformance. It can be done at any time and are also used to verify defect repairs. Also known as review, peer review, audit or walkthroughs. Approved Change Request Review All approved change requests should be reviewed to verify that they were implemented as approved.
QUALITY MANAGEMENT QA/ QC TOOLS
Basic Layout of Cause-and-Effect Diagrams CAUSE A CAUSE C EFFECT EFFECT CAUSE B CAUSE D
Basic Layout of Cause-and-Effect Diagrams EFFECT Poor Gas Mileage
Basic Layout of Cause-and-Effect Diagrams Methods Machinery EFFECT Poor Gas Mileage People Material
Basic Layout of Cause-and-Effect Diagrams Methods Machinery Underinflated tires Use wrong gears Drive too fast EFFECT Poor Gas Mileage Carburetor Adjustment Improper lubrication Poor Maintenance Poor driving habits Poor quality gas People Material
Basic Layout of Cause-and-Effect Diagrams Methods Machinery Impatient Use wrong gears Underinflated tires Always Late Poor Hearing Drive too fast Music too loud Poor Gas Mileage EFFECT Cant hear engine Carburetor Adjustment Improper lubrication Poor Maintenance Lazy Poor driving habits Rs: Poor quality gas People Material
“Quality is the result of a carefully constructed cultural environment. It has to be the fabric of the organization, not the part of the fabric” PHILIP CROSBY