Download
1 / 22
220 likes | 348 Views
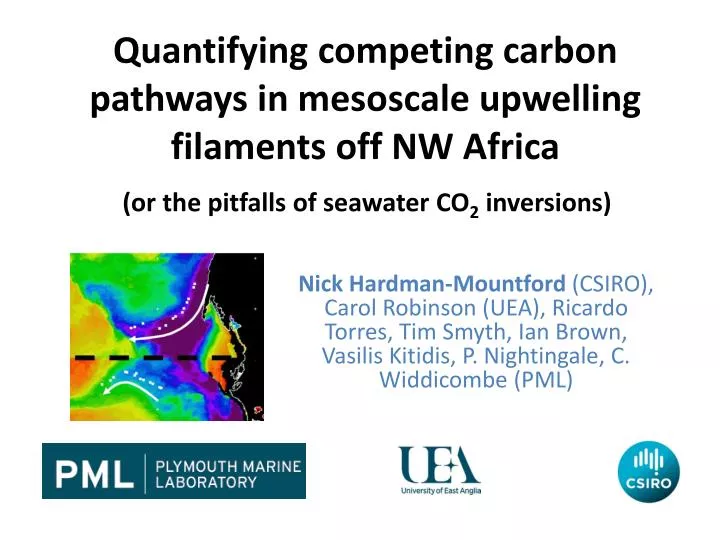
Quantifying competing carbon pathways in mesoscale upwelling filaments off NW Africa. (or the pitfalls of seawater CO 2 inversions). Nick Hardman-Mountford (CSIRO), Carol Robinson (UEA), Ricardo Torres, Tim Smyth, Ian Brown, Vasilis Kitidis, P. Nightingale, C. Widdicombe (PML).

E N D
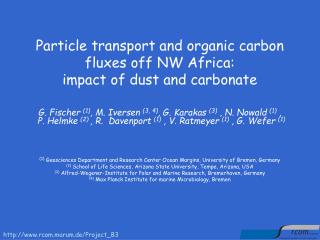
Quantifying competing carbon pathways in mesoscale upwelling filaments off NW Africa (or the pitfalls of seawater CO2 inversions) Nick Hardman-Mountford (CSIRO), Carol Robinson (UEA), Ricardo Torres, Tim Smyth, Ian Brown, Vasilis Kitidis, P. Nightingale, C. Widdicombe (PML)
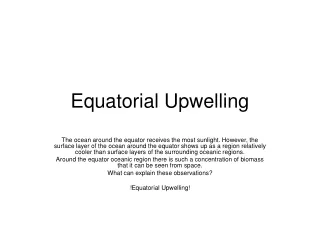
What is relative contribution of different CO2 pathways: air-sea flux vs. export production? NCP = E
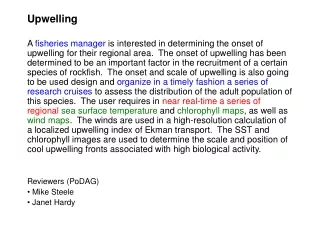
Lagrangian study: plume tracking with SF6 and drifters SOLAS-ICON+(D338) • 3 patches seeded • P1 & P3 filaments tracked • P2 subducted Rees et al. 2011 +The impact of coastal upwelling on the air-sea exchange of climatically important gases
Sampling Rosette bottle samples Deck incubations Physics: CTD, MVP, ADCP, micro-turbulence, wirewalker, optics Surface drifters: T, S, fCO2 Underway: T, S, fCO2, O2, Fl
Spatial structure – satellite view Patch 1: freshly upwelled, followed for 9 days Patch 3: ~10 days old, followed for 8 days
Phytoplankton community and primary production Patch 1 Patch 3
Controls on CO2 dynamics Shadwick et al. 2010 ? Horizontal diffusion flux Vertical entrainment (ventilation) Horizontal advection Sea-air Flux Vertical diffusion flux NCP Daily DIC change • Assume advection/diffusion terms negligible because lagrangianexpt, i.e. tracking water patch. • Supported by lack of relationship between salinity and DIC within patch • Salinity normalise DIC to make sure • Focus on NCP, F and V?
DIC calculations • Need continuous DIC • Use discrete TA / S relationship to calculate continuous TAs • Calculate DIC from TAs and measured underway fCO2 in CO2SYS • Salinity normalise calculated DIC = nDIC
Daily δnDIC calculation Time δnDICday+night δnDICday nDIC δnDICnight depth integrated NCPt = Zeut(max DICt- max DICt-1) – Ft (– Vt)
A. Daily nDIC change Patch 1 • Daily DIC reduction • Night time DIC increase • production/respiration signal • Patch 1 has larger signals and is more variable than Patch 3 Patch 3
B. Sea-air CO2 fluxes Patch 1 Calculated using Nightingale et al. (2000) Winds 6-14 m s-1 P1, 8-14 m s-1 P3 ΔpCO2 20-100 µatm P1, 60-110 µatm P3 Patch 1 sea-air flux starts high and reduces as seawater pCO2 reduces Increase on 25-26/4 from ventilation? Patch 3 sea-air flux higher on average, more gradual decline, driven by seawater pCO2 decline Patch 3
C. Depth Integrated NCP* vs. sea-air flux Patch 1 Patch 1 Louicades et al. 2011 Patch 3
C. Depth Integrated NCP* vs. sea-air flux Patch 1 Patch 1 is net autotrophic and NCP* dominates over sea-air flux Patch 3 shifts from autotrophic to heterotrophic between days In ~trophic balance over all NCP* dominates the signal but overall sea-air flux is greater Patch 3
Water masses NACW>50% Max(80%,75m) Patch 1 SACW>50% Max(95%,300m) Patch 3 SACW<50% Max(40%,150m) (NACW or BDA shelfwater) SACW>50% (Max 100%)
D. NCP vs. entrainment/ventilation vs. sea-air flux Use change in nutricline depth and DIC gradient over nutricline NCP (residual) has to increase with ventilation Accounting for ventilation increases estimate of autotrophy - Is it real?
Preliminary conclusions • Biogeochemistry different between filaments: • phytoplankton, CO2dynamics, [nutrients] • Water masses or age? • Variable influence of NCP vs Sea-Air Flux • Patch 1: net autotrophic, NCP dominates; sea-air CO2 flux has minor influence • Patch 3:trophic status looks neutral but depends on external sources of DIC; sea-air CO2 flux may be dominant over time • Method • Ventilation calculation critical for determining NCP? • Method needs testing / refining for a lagrangian/sub-mesoscale framework
Next steps • Consider sub-mesoscale physics to calculate ventilation fluxes • Compare results with DOC, C14 PP, O18 R, N-flux estimates • Look at heterotrophic dynamics (diurnal variability in grazing?)
Thank you! Acknowledgements: UK-SOLAS ICON team, National Marine Facilities staff, Captain and crew of RRS Discovery. Funding: UK Natural Environment Research Council (NERC). Satellite images provided by NEODAAS, UK.
B. Sea-air CO2 fluxes Units on time plots legend!!!