Download
1 / 28
280 likes | 423 Views
Today’s forecast:. Observations D.Jaffe T. VanCuren R. Husar J.Creilson. Trans-Pacific Transport of Pollutants: Key Results and Uncertainties by Dan Jaffe, University of Washington Bothell. Acknowledgements: My research team and collaborators Funding: NSF, EPA, NOAA, NPS.

E N D
Today’s forecast: Observations D.Jaffe T. VanCuren R. Husar J.Creilson
Trans-Pacific Transport of Pollutants: Key Results and Uncertainties by Dan Jaffe, University of Washington Bothell Acknowledgements: My research team and collaborators Funding: NSF, EPA, NOAA, NPS
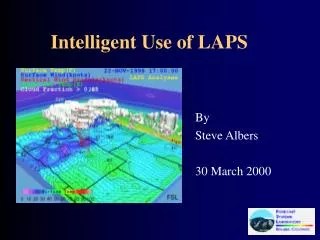
Our observations sites in the Northwestern U.S. 0-6 km asl 2.7 km asl 0.5 km asl Extensive ground and airborne observations since 1997. Focus on O3, PM, toxics: The PHOBEA project
Key results-I • Since 1997, we have identified several dozen episodes of long-range transport (LRT) to the west coast, including Asian industrial emissions, mineral dust and Siberian biomass burning emissions [Jaffe et al., 1999; 2001, 2003; Price et al., 2003; 2004, Bertschi et al., 2003;2004]; • The eastern North Pacific atmosphere is a region of slight net O3 destruction. PAN plays an important role in the O3 budget (Kotchenruther et al., 2001a,b]; • There is substantial year-to-year variability in the transport and concentrations [Price et al., 2003; Jaffe et al., 2004a]; • Springtime shows the strongest LRT, but other seasons can also be important [Bertschi et al., 2004; Jaffe et al., 2004a]; • Background aerosol concentrations appear to be adequately monitored on the west coast of the U.S. There does not appear to be any trend over the past 15 years in background aerosol concentrations associated with LRT [Jaffe et al., 2004b];
Key results-II • LRT can sometimes increase BL concentrations to levels that approach or exceed the air quality standards. [Jaffe et al., 2003; 2004]; • GEOS-CHEM does an excellent job of simulating CO conc. in the air arriving to the west coast, but there are greater uncertainties associated with O3and non-industrial sources; • Background O3 concentrations are not well monitored on the west coast. At the one observation site with long term background data, there has been a statistically significant increase of 10 ppbv since 1988 [Jaffe et al., 2003]; • We have now detected LRT of Hg from Asian. The majority of the transported Hg appears to be Hgo, rather than as oxidized or particulate Hg [Jaffe et al., 2004b]; • The Hg/CO ratio is a robust indicator of Asian industrial emissions, but there is a significant discrepancy with the Hg emission inventory [Jaffe et al., 2004b].
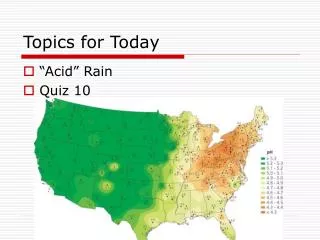
It’s not just industrial sources… Forest fires Industry Dust
TOMS Aerosol Index (AI) for mid-April 2001 April 8, 2001 April 12, 2001 April 14, 2001
LRT can sometimes increase urban concentrations to levels that approach or exceed the air quality standardsContribution of the April 2001 Asian dust episode to air quality in several urban areas of the U.S.
Huge Siberian fires in the summer of 2003 Approximately 19 million ha!
NAAPS Model Forecast for June 2, 2003 Vertical profile
June 2nd, 2003 vertical profile Red line shows summer median NRL-NAAPS model and NOAA-Hysplit back trajectories confirm the Siberian source.
Impact of June 2003 Siberian forest fires on air quality in Seattle Based on observations on June 6, 2003 at Enumclaw, Washington [Jaffe et al., 2004].
Influence of Siberian fires on background O3 in western N.A. (10 sites in Ak, BC and Washington) Area Burned Ak, BC and Wa O3 The R2 for the O3-Area burned correlation is 0.65. The pattern holds for background CO and at each site individually [Jaffe et al., 2004].
PHOBEA data-GEOS-CHEM model comparisonSpring 2001, NE Pacific CO Ozone Jaeglé et al 2003
Is there any evidence that background O3 has changed? Ozone observations 1988-2002 from NPS site at Lassen N.P. segregated by trajectories to eliminate local influence Trend is statistically significant in all seasons but strongest in spring-summer [Jaffe et al., 2003].
Influence of Asian NOx emissions on spring surface O3 along the west coast of the U.S. Oslo CTM: Berntsen et al, 1999 (1996 emissions) GFDL CTM: Yienger et al., 2000 (1990 emissions) GEOS-CHEM: Jaeglé et al., 2001 (1998 emissions)
Spring 2004 Experiment: Simultaneous Mercury Observations at Mt.Bachelor and Okinawa 2.7 km MBO Okinawa Okinawa: Hg0, RGM, PHg (Tekran 2537, 1130, 1135), CO, O3, aerosols, etc. MBO: Total Hg (Tekran 2537 w/high temperature quartz inlet), CO, O3, aerosols, etc.
6 2 1 5 3 4
Hg transport to Mt. Bachelor: April 25th, 2004 This was a substantial Asian LRT events with ΔCO > 100 ppbv
Observed ΔHg/ ΔCO ratios in Asian plumes In observations of N.A. pollution at MBO, the Hg/CO ratio is at least an order of magnitude lower, consistent with the U.S. emissions inventory. Hg/CO ratio appears to be good marker for the Asian plume! Jaffe et al., 2004, submitted.
Comparison of observed Hg/CO ratio with Asian emission inventory CO emissions for yr 2001 from Palmer et al 2003. Hg emissions for yr 2000 from Pacyna et al 2003. There is a significant discrepancy between the emissions inventory and the observed ratio. There are several possible causes, but we need to understand this!
Uncertainties/Research needs • Need additional long term monitoring sites on the west coast for ozone, especially at altitude; • Need additional detailed comparisons with observations to validate global models, especially w.r.t. O3 and PM budgets; • Need additional studies to understand the cause for the significant discrepancy in the Asian Hg inventory; • Need additional studies to better quantify the episodic, non-industrial sources (mineral dust and biomass burning).
Mt. Bachelor Observatory at 2.7 km aslFree tropospheric air?
Another day at the office… MBO, 2.7 km asl For publications on Pacific-LRT and real-time data from MBO and CPO, go to: http://faculty.washington.edu/djaffe
Some reflections on Inter-continental transport • Don’t use inter-continental transport as justification to delay reductions; • Need good scientific information on ICT to evaluate true impacts of policy decisions; • Need model evaluation against point observations in space and time…. Today’s forecast: