Download
1 / 24
240 likes | 381 Views
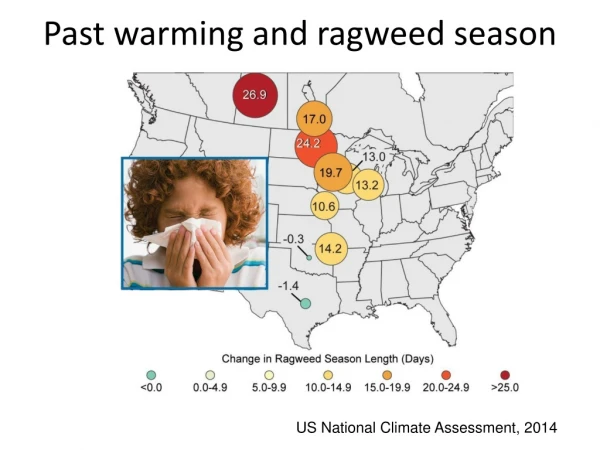
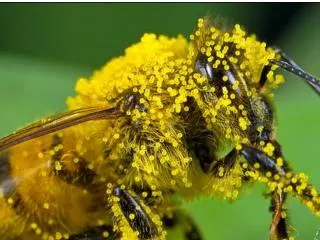
EVALUATION OF RAGWEED FORECASTING IN TULSA. Estelle Levetin, PhD The University of Tulsa. Ambrosia Pollen. Most important pollen allergen in N.A. In Tulsa area, cumulative Ambrosia pollen is first or second in terms of yearly abundance

E N D
EVALUATION OF RAGWEED FORECASTING IN TULSA Estelle Levetin, PhD The University of Tulsa
Ambrosia Pollen • Most important pollen allergen in N.A. • In Tulsa area, cumulative Ambrosia pollen is first or second in terms of yearly abundance • The ability to accurately predict day to day pollen levels could provide important benefit to sensitive individuals either by avoidance or by taking prophylactic medication
Standof Ambrosia trifida along the east bank of the Arkansas River
Flowering in Ragweed • Controlled by photoperiod • Pollination is the same time each year at a given location unless stressful climatic conditions influence growth and reproduction in the plants. • Once pollination begins, pollen release and atmospheric pollen concentrations are influenced by meteorological conditions.
Pollen Forecasts from TU • Multiple regression models • Empirical model for mountain cedar pollen release coupled with HY-SPLIT dispersion model • Development of ragweed forecasts • Empirical Model • Ragweed Pollen Forecaster (computer software) generated by 6 students from Dept of Computer Science (Cyber Corp)
Air Sampling • Burkard Spore Trap has been used for air sampling in Tulsa since Dec. 1986 • Ragweed data from 1987 to 2001 was used to determine pollen season characteristics • Start date - 5% of season total) • End date – 95% of season total • Typical peak date
Pollen Season Characteristics • Mean start date (5% of season total) – 27 Aug • Mean end date (95% of season total) – 11 Oct • Mean peak date – 10 Sep
Empirical Model • Pollen concentrations compared with data from the National Weather Service to determine the effects of meteorological conditions on airborne pollen levels • Empirical model was developed based on phenology and the weather forecast • NGM-MOS 60 hour forecasts were used • Model was used to generate pollen forecasts for the 2002 and 2003 ragweed seasons • Comparison with the atmospheric ragweed pollen concentrations was used to evaluate the model
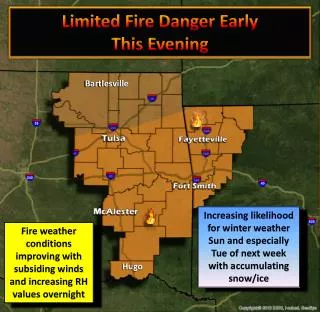
What conditions trigger pollen entrainment? • No rain • Sunshine • Low humidity (below 75%)? • Moderate to high wind speeds • Afternoon temperatures below 95oF • Morning temperatures above 65oF • Phenological phase
What are Low, Moderate, High, and Very High Values? *Burge, H.A. 1992. Monitoring for Airborne Allergens. Annals of Allergy, 69: 9-18
Forecasting Model • Phenology Factor (PF) – based on day in the pollen season and 15 year mean concentration (Range 1 to 6) • Metereological forecasts from NGM-MOS 60 hr forecast • R – forecast of rain (- variable amount) • T – temp outside optimum range (morning temperature < 65 F or afternoon temperature > 95 F) (- variable amount) • RH – forecast of noon relative humidity >75% (-1) • W-sp – wind speeds >15 mph (+1) • W-dir – wind from N - Aug 15-31 or wind from S - Oct 1-31 (+1) • Pre – Preseason weather – hot, dry July and August (-1) Forecast = PF – R – T – RH + W-sp + W-dir – Pre
Computer Program Evaluation • Correct forecast 34 days (49%) • Incorrect forecast 13 days (19%) • No forecast data 23 days (32%) • For the 47 days with data: 72% correct
Conclusions • Empirical model accurately predicted the pollen level on 84% of the days during the 2002 and 2003 ragweed seasons (74% using NAB levels) • Computer program needs more work • Pollen forecasts are only as accurate as the meteorological forecasts • More research is needed on the • effects of RH and rain on pollen release and dispersal • influence of pre-season meteorological conditions on the seasonal pollen potential
Acknowledgment The assistance of Claudia Owens, Shernell Surratt, and Christen Townsend in counting pollen is greatly appreciated.