Download
1 / 27
270 likes | 295 Views
Study of E.coli levels in West Fork Whitewater River and tributaries under varying flow and moisture conditions. Data from IDEM and USGS. Analysis includes contamination levels and risk assessment.

E N D
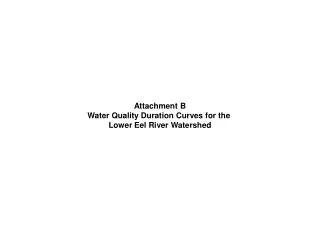
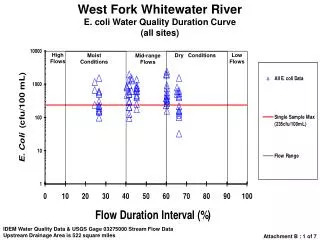
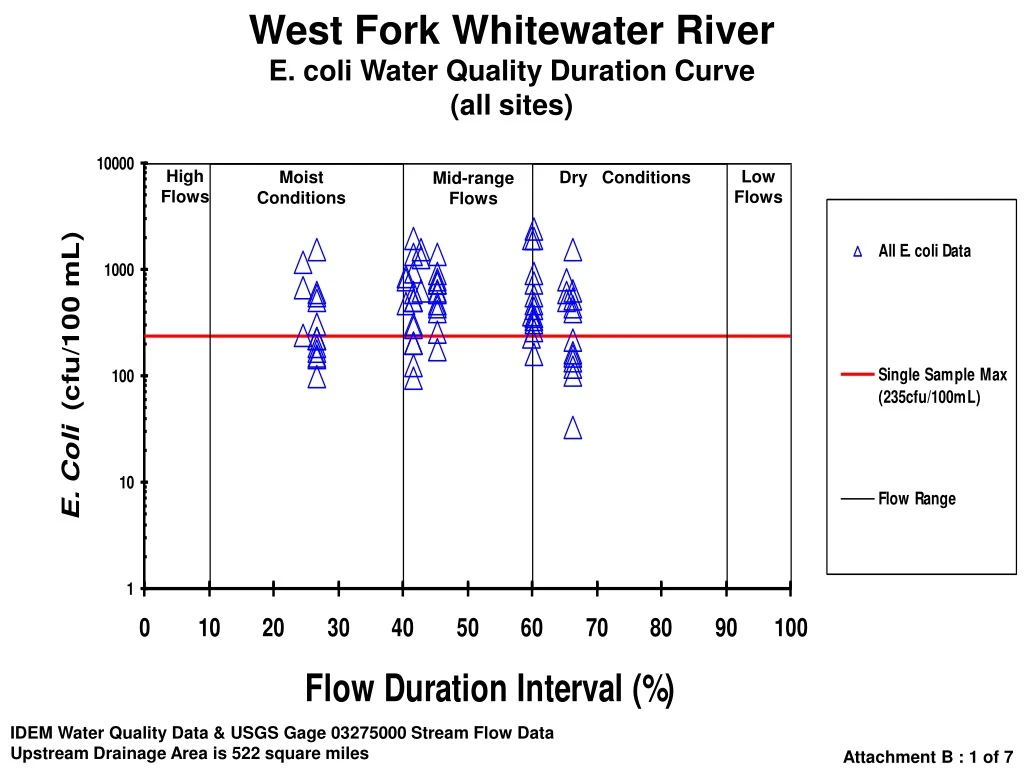
West Fork Whitewater RiverE. coli Water Quality Duration Curve (all sites) High Flows Low Flows Moist Conditions Dry Conditions Mid-range Flows IDEM Water Quality Data & USGS Gage 03275000 Stream Flow Data Upstream Drainage Area is 522 square miles Attachment B : 1 of 7
Unnamed Tributary at Crietz Park, Cambridge City, INE. coli Water Quality Duration Curve - Site: GMW010-0030 Low Flows Moist Conditions High Flows Dry Conditions Mid-range Flows IDEM Water Quality Data & USGS Gage 03275000 Stream Flow Data Upstream Drainage Area is 1.0 square miles Attachment B : 2 of 7
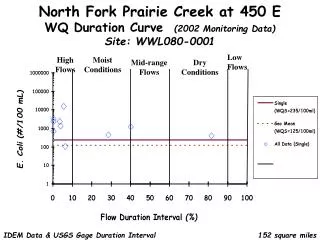
West Fork Whitewater River at CR 440 E near Waterloo, INE. coli Water Quality Duration Curve - Site: GMW020-0025 Low Flows Moist Conditions High Flows Dry Conditions Mid-range Flows IDEM Water Quality Data & USGS Gage 03275000 Stream Flow Data Upstream Drainage Area is 310 square miles Attachment B : 3 of 7
Nolands Fork at Fountain City Park, Fountain City, INE. coli Water Quality Duration Curve - Site: GMW030-0004 Low Flows Moist Conditions High Flows Dry Conditions Mid-range Flows IDEM Water Quality Data & USGS Gage 03275000 Stream Flow Data Upstream Drainage Area is 17.0 square miles Attachment B : 4 of 7
Morgan Creek at SR 38 E. coli Water Quality Duration Curve - Site: GMW010-0028 Low Flows Moist Conditions High Flows Dry Conditions Mid-range Flows IDEM Water Quality Data & USGS Gage 03275000 Stream Flow Data Upstream Drainage Area is 15.0 square miles Attachment B : 5 of 7
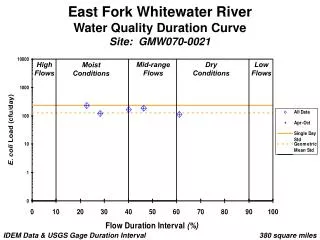
Greens Fork at US 35 near Williamsburg, INE. coli Water Quality Duration Curve - Site: GMW020-0023 Low Flows Moist Conditions High Flows Dry Conditions Mid-range Flows IDEM Water Quality Data & USGS Gage 03275000 Stream Flow Data Upstream Drainage Area is 49.0 square miles Attachment B : 6 of 7
Nolands Fork at SR 38E. coli Water Quality Duration Curve - Site: GMW030-0015 Low Flows Moist Conditions High Flows Dry Conditions Mid-range Flows IDEM Water Quality Data & USGS Gage 03275000 Stream Flow Data Upstream Drainage Area is 42.0 square miles Attachment B : 7 of 7
West Fork Whitewater RiverE. coli Load Duration Curve (all sites) High Flows Moist Conditions Mid-range Flows Dry Conditions Low Flows (100 Trillion) (10 Trillion) (1 Trillion) (100 Billion) IDEM Water Quality Data & USGS Gage 03275000 Stream Flow Data Upstream Drainage Area is 522 square miles Attachment C : 1 of 7
Unnamed Tributary at Crietz Park, Cambridge City, INE. coli Load Duration Curve - Site: GMW010-0030 High Flows Moist Conditions Mid-range Flows Dry Conditions Low Flows (100 Trillion) (10 Trillion) (1 Trillion) (100 Billion) IDEM Water Quality Data & USGS Gage 03275000 Stream Flow Data Upstream Drainage Area is 1.0 square miles Attachment C : 2 of 7
West Fork Whitewater River at CR 440 E near Waterloo, INE. coli Load Duration Curve - Site: GMW020-0025 High Flows Moist Conditions Mid-range Flows Dry Conditions Low Flows (100 Trillion) (10 Trillion) (1 Trillion) (100 Billion) IDEM Water Quality Data & USGS Gage 03275000 Stream Flow Data Upstream Drainage Area is 310 square miles Attachment C : 3 of 7
Nolands Fork at Fountain City Park, Fountain City, INE. coli Load Duration Curve - Site: GMW030-0004 High Flows Moist Conditions Mid-range Flows Dry Conditions Low Flows (100 Trillion) (10 Trillion) (1 Trillion) (100 Billion) IDEM Water Quality Data & USGS Gage 03275000 Stream Flow Data Upstream Drainage Area is 17.0 square miles Attachment C : 4 of 7
Morgan Creek at SR 38E. coli Load Duration Curve - Site: GMW010-0028 High Flows Moist Conditions Mid-range Flows Dry Conditions Low Flows (100 Trillion) (10 Trillion) (1 Trillion) (100 Billion) IDEM Water Quality Data & USGS Gage 03275000 Stream Flow Data Upstream Drainage Area is 15.0 square miles Attachment C : 5 of 7
Greens Fork at US 35 near Williamsburg, INE. coli Load Duration Curve - Site: GMW020-0023 High Flows Moist Conditions Mid-range Flows Dry Conditions Low Flows (100 Trillion) (10 Trillion) (1 Trillion) (100 Billion) IDEM Water Quality Data & USGS Gage 03275000 Stream Flow Data Upstream Drainage Area is 49.0 square miles Attachment C : 6 of 7
Nolands Fork at SR 38E. coli Load Duration Curve - Site: GMW030-0015 High Flows Moist Conditions Mid-range Flows Dry Conditions Low Flows (100 Trillion) (10 Trillion) (1 Trillion) (100 Billion) IDEM Water Quality Data & USGS Gage 03275000 Stream Flow Data Upstream Drainage Area is 42.0 square miles Attachment C : 7 of 7
GMW010-0030 GEOMEAN = 1500 MPN/100mL 4 2 1 5 3 UPSTREAM 4 5 1 2 3 DOWNSTREAM
GMW020-0025 GEOMEAN = 209 MPN/100mL 3 4 2 1 5 4 1 3 5 2
GMW030-0004 GEOMEAN = 1092 MPN/100mL 4 3 2 1 5 4 3 1 2 5
GMW010-0028 GEOMEAN = 619 MPN/100mL 2 4 3 1 5 UPSTREAM 2 3 4 1 5 DOWNSTREAM
GMW020-0023 GEOMEAN = 395 MPN/100mL 1 2 5 4 3 3 5 2 4 1
2 1 3 4 5 GMW030-0015 GEOMEAN = 650 MPN/100mL 2 3 4 1 5