WEB-BASED LOAD DURATION CURVE
200 likes | 318 Views
This innovative web-based tool developed at Purdue University allows users to analyze Flow Duration Curves (FDC) and Load Duration Curves (LDC) by entering or uploading flow and water quality data. Users can retrieve USGS flow data using gauge numbers and analyze flood conditions from historical data. The tool facilitates detailed analysis of water quality pollutants and compliance with environmental standards, including ammonia concentrations. It's designed for researchers and water quality managers seeking to generate and visualize essential hydrological data graphs easily.

WEB-BASED LOAD DURATION CURVE
E N D
Presentation Transcript
WEB-BASED LOAD DURATION CURVE Indrajeet Chaubey Purdue University
Collaborators Christine Urban – EPA Region 5 Bernard Engel, James Hunter, Joseph Quansah, Larry Theller – Purdue University K.J. Lim – Kangwon National University S. Goodwin – IDEM Thomas Over - USGS
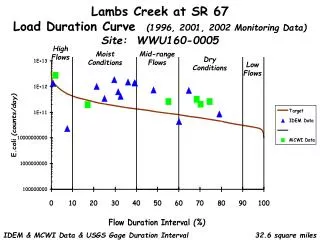
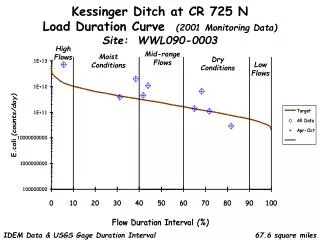
Flow Duration Curve (FDC) Flow Duration Curve (Adapted from USEPA, 2007)
Load Duration Curve (LDC) Out of compliance In compliance Flow Duration Curve (USEPA, 2007)
Web-Based Flow Duration and Load Duration Curve Tool
1. Enter/Upload Flow Data for FDC This option lets you enter your own flow data directly on the spreadsheet This option lets you upload your own flow data from an existing file
1A. Enter Flow Data for FDC FDC – Analysis Flood Conditions 100 cfs Flow Duration Curve (2002-2007) for USGS Gauge 04180000, Cedar Creek, IN
1A. Enter Flow Data for FDC You can download the dataset by Clicking on this button You can click on the graph/image to save it on your computer
2. Enter / Upload Flow and WQ Data for LDC This option lets you enter your own flow and WQ data directly on the spreadsheet This option lets you upload your own flow and WQ data from an existing file
2A. Enter / Upload Flow and WQ Data for LDC You can type your own description here You can type water quality pollutant name here WQ unit can be ppm, ppb or count/100ml Flow unit can be either cms or cfs Date should be in yyyymmdd format You can enter WQ standard or criteria value Clicking this button will create the FDC and LDC
2. Enter / Upload Flow and WQ Data for LDC FDC –Analysis Flood Conditions 100 cfs Flow Duration Curve (2002-2007) for USGS Gauge 04180000, Cedar Creek, IN
2. Enter / Upload Flow and WQ Data for LDC FDC – Result Analysis LDC (2002-2007) for Ammonia at USGS Gauge 04180000, Cedar Creek, IN
2. Enter / Upload Flow and WQ Data for LDC FDC – Result Analysis WQ Target (0.10 ppm) Target Concentration Graph for Ammonia at USGS Gauge 04180000, Cedar Creek,
3. Retrieve USGS Flow Data and Enter /Upload WQ Data for LDC 3 This option lets you use Google to select a USGS Gauge and directly upload flow data into the tool This option lets you enter a USGS Gauge number to directly upload flow data into the tool
3A. Retrieve USGS Flow Data and /Upload WQ Data for LDC You can click here to retrieve USGS flow data
3A. Retrieve USGS Flow Data and Enter /Upload WQ Data for LDC 3 Select beginning and Ending dates Click this button to Generate FDC only
3A. Retrieve USGS Flow Data and Enter /Upload WQ Data for LDC You can type your own Description here Flow unit can be either cms or cfs Select beginning and Ending dates WQ unit can be ppm, ppb or count/100ml You can type water quality pollutant name here You can enter WQ standard value Click this button to Generate LDC
4. Using USGS Flow Data * Drainage Area Ratio and Entered /Uploaded WQ Data for LDC Enter Watershed Area-Ratio This option lets you enter a USGS Gauge number to directly upload flow data into the tool This option lets you use Google to select a USGS Gauge and directly upload flow data into the tool
5. Enter Flow and WQ Data for LDC with Surface-runoff and Estimated Loads You can type your own Description here WQ unit can be ppm, ppb or count/100ml Select Aquifer Type Date should be in yyyymmdd format Flow unit can be either cms or cfs
Please visit the link below for most up to date information on FDC and LDC https://engineering.purdue.edu/~ldc