A METRICS System for Design Process Optimization
240 likes | 416 Views
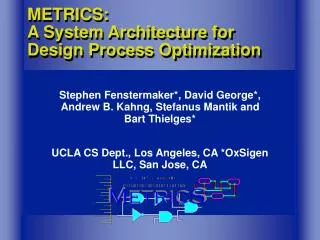
A METRICS System for Design Process Optimization. Andrew B. Kahng and Stefanus Mantik* UCSD CSE and ECE Depts., La Jolla, CA *UCLA CS Dept., Los Angeles, CA. Purpose of METRICS. Standard infrastructure for the collection and the storage of design process information

A METRICS System for Design Process Optimization
E N D
Presentation Transcript
A METRICS System for Design Process Optimization Andrew B. Kahng and Stefanus Mantik* UCSD CSE and ECE Depts., La Jolla, CA *UCLA CS Dept., Los Angeles, CA
Purpose of METRICS • Standard infrastructure for the collection and the storage of design process information • Standard list of design metrics and process metrics • Analyses and reports that are useful for design process optimization METRICS allows: Collect, Data-Mine, Measure, Diagnose, then Improve
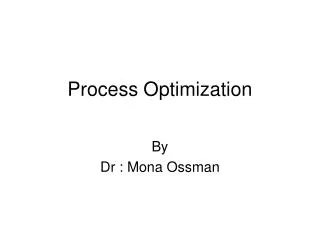
Tool Tool Transmitter Java Applets wrapper Tool API Transmitter Transmitter XML Inter/Intra-net Web Server Data Mining DB Reporting Metrics Data Warehouse METRICS System Architecture
XML Example <METRICS_LIST> <METRIC PID=“134” FID=“22” TID=“47”> <NAME>TOTAL_WIRELENGTH</NAME> <VALUE>14250347</VALUE> <TYPE>INTEGER</TYPE> <TIMESTAMP>010312:220512</TIMESTAMP> </METRIC> <METRIC PID=“134” FID=“22” TID=“47”> <NAME>TOTAL_CPU_TIME</NAME> <VALUE>2150.28</VALUE> <TYPE>DOUBLE</TYPE> <TIMESTAMP>010312:220514</TIMESTAMP> </METRIC> </METRICS_LIST>
Wrapper-based transmitter #!/usr/local/bin/perl -w $TOOL = $0; $PID = `initProject`; $FID = `initFlow -pid ${PID}`; $TID = `initToolRun -pid ${PID} -fid ${FID}`; system “sendMetrics TOOL_NAME ${TOOL}\ STRING”; … while(<IN>) { … system “sendMetrics ${NAME} ${VALUE}\ ${TYPE}”; … } system “terminateToolRun”; system “terminateFlow -pid ${PID} -fid ${FID}”; system “terminateProject -pid ${PID}”; exit 0; API-based transmitter #include “transmitter.h” int main(int argc, char* argv[]) { Transmitter MTR; MTR.initProject(); MTR.initFlow(); MTR.initToolRun(); MTR.sendMetrics(“TOOL_NAME”, argv[0],\ “STRING”); … MTR.sendMetrics(Name, Value, Type); … MTR.terminateToolRun(); MTR.terminateFlow(); MTR.terminateProject(); exit 0; } Transmitter Examples
donkey 2% rat 1% bull 2% synthesis 20% ATPG 22% postSyntTA 13% BA 8% funcSim 7% hen 95% placedTA 7% physical 18% LVS 5% % aborted per task % aborted per machine Example Reports CPU_TIME = 12 + 0.027 NUM_CELLS Correlation = 0.93
Report EJB DB XFace EJB X’Mit EJB METRICS Server Apache Reports Reporting Servlets Oracle 8i Requests Transmitter Servlets
Open Source Architecture • METRICS components are industry standards • e.g., Oracle 8i, Java servlets, XML, Apache web server, PERL/TCL scripts, etc. • Custom generated codes for wrappers and APIs are publicly available • collaboration in development of wrappers and APIs • porting to different operating systems • Codes are available at: http://vlsicad.cs.ucla.edu/GSRC/METRICS
METRICS Standards • Standard metrics naming across tools • same name «same meaning, independent of tool supplier • generic metrics and tool-specific metrics • no more ad hoc, incomparable log files • Standard schema for metrics database • Standard middleware for database interface • For complete current lists see: http://vlsicad.cs.ucla.edu/GSRC/METRICS
Generic and Specific Tool Metrics Partial list of metrics now being collected in Oracle8i
Flow Metrics • Tool metrics alone are not enough • Design process consists of more than one tool • A given tool can be run multiple times • Design quality depends on the design flow and methodology (the order of the tools and the iteration within the flow) • Flow definition • Directed graph G (V,E) • V T { S, F } • T { T1, T2, T3, …, Tn } (a set of tasks) • S starting node, F ending node • E { Es1, E11, E12, …, Exy } (a set of edges) • Exy • x < y forward path • x = y self-loop • x > y backward path
S T1 T1 T1 T2 T2 T2 T2 T3 T3 T3 T4 T4 F Flow Example S T1 T2 T3 Optional task T4 F Task sequence: T1, T2, T1, T2, T3, T3, T3, T4, T2, T1, T2, T4
S T1 T1 T1 T2 T2 T2 T2 T3 T3 T3 T4 T4 F Flow Tracking Task sequence: T1, T2, T1, T2, T3, T3, T3, T4, T2, T1, T2, T4
S T1 T2 T3 T4 T5 T6 T7 T8 F Chip Design Flow Example • Simple chip design flow • T1 = synthesis & technology mapping • T2 = load wireload model (WLM) • T3 = pre-placement optimization • T4 = placement • T5 = post-placement optimization • T6 = global routing • T7 = final routing • T8 = custom WLM generation
... T1 T2 T3 Tn S F Optimization of Incremental Multilevel FM Partitioning • Motivation: Incremental Netlist Partitioning • Given: initial partitioning solution, CPU budget and instance perturbations (I) • Find: number of parts of incremental partitioning and number of starts • Ti = incremental multilevel FM partitioning • Self-loop multistart • n number of breakups (I = 1 + 2 + 3 + ... + n)
Predicted CPU Time (secs) Actual CPU Time (secs) Flow Optimization Results • If (27401 < num edges 34826) and (143.09 < cpu time 165.28) and (perturbation delta 0.1) then num_inc_parts = 4 and num_starts = 3 • If (27401 < num edges 34826) and (85.27 < cpu time 143.09) and (perturbation delta 0.1) then num_inc_parts = 2 and num_starts = 1 • ...
Java Servlet Java Servlet Datamining Integration Inter-/Intranet DM Requests SQL Results Tables Database Datamining Interface Datamining Tool(s) Tables Tables SQL Results
Categories of Data for DataMining • Design instances and design parameters • attributes and metrics of the design instances • e.g., number of gates, target clock frequency, number of metal layers, etc. • CAD tools and invocation options • list of tools and user options that are available • e.g., tool version, optimism level, timing driven option, etc. • Design solutions and result qualities • qualities of the solutions obtained from given tools and design instances • e.g., number of timing violations, total tool runtime, layout area, etc.
Possible Usage of DataMining • Design instances and design parameters • CAD tools and invocation options • Design solutions and result qualities • Given and , estimate the expected quality of • e.g., runtime predictions, wirelength estimations, etc. • Given and , find the appropriate setting of • e.g., best value for a specific option, etc. • Given and , identify the subspace of that is “doable” for the tool • e.g., category of designs that are suitable for the given tools, etc.
Predicted CPU Time (secs) Actual CPU Time (secs) DM Results: QPlace CPU Time • If (num nets 7332) then CPU time = 21.9 + 0.0019 num cells + 0.0005 num nets + 0.07 num pads - 0.0002 num fixed cells • If (num overlap layers = 0) and (num cells 71413) and (TD routing option = false) then CPU time = -15.6 + 0.0888 num nets - 0.0559 num cells - 0.0015 num fixed cells - num routing layer • ...
Synthesis & Tech Map Pre-placement Opt Post-placement Opt QP GRoute WRoute Testbed: Metricized Cadence PKS Flow M E T R I C S BuildGates
NELSIS Flow Manager Integration • Flow managed by NELSIS
Issues • Tool interface: each tool has unique interface • Security: proprietary and confidential information • Standardization: flow, terminology, data management, etc. • Cost of metrics collection: how many data are too many? • Other non-EDA tools: LSF, License Manager, etc. • Social: “big brother”, collection of social metrics, etc. • Bug detection: report the configuration that trigger the bugs, etc.
Conclusions • Metrics collection should be automatic and transparent • API-based transmitter is the “best” approach • Ongoing work with EDA, designer communities to identify tool metrics of interest • users: metrics needed for design process insight, optimization • vendors: implementation of the metrics requested, with standardized naming / semantics