Download
1 / 62
620 likes | 654 Views
Explore theories, data, and research on the causes of global inequality and economic performance, using GDP and alternative indicators. Collaborative CLIO INFRA project provides global datasets. Discover historical trajectories and well-being measures beyond GDP.

E N D
Global Inequality Jan Luiten van Zanden UU/Groningen/Stellenbosch
Three issues Global Inquality & long-term trends in world economy 1500-2010: the GDP evidence Beyond GDP: OECD report Why: theories and speculations
The questions Why are some countries rich and others poor? Why are some countries less unequal than others? Are we measuring economic performance ‘correctly’?
Recent trends in research Trying to get the ‘big picture’, and searching for the ‘deep’ roots of development and underdevelopment (Engermann & Sokoloff, Acemoglu et.al., Nunn) New research on non-western world: China, Japan, India (‘Great Divergence debate’) The ‘problem’ of Africa
Recent trends in research From research focused on nation state to international-comparative and ‘global’ research Need for large global datasets, example Maddison estimates of GDP and population To answer questions about when (did global inequality begin to increase?) and why?
What we need: Better estimates of the ‘usual’ indicators (such as GDP) Alternative indicators: real wages, life expectancy, biological standard of living, ‘agency’ (Sen) Datasets about proximate and ultimate causes of growth and stagnation: human capital, institutions, family systems, culture and religion, knowledge production (books?), geography etc. How does growth affect sustainability? For the period 1500-2010, for the whole world
Approach CLIO INFRA Set of specialized hubs that produce global datasets Central website at International Institute for Social History (IISH) Cooperation with Gapminder and Statplanet And with Data Archive DANS for datastorage
CLIO INFRA consists of Thematic datahubs: National Accounts: the Maddison project (Groningen) Biological Standard of Living and Age heaping (Tuebingen) Human Capital Formation (Debrecen/Utrecht) Demography, Gender, Labour Status (IISH) Prices and Wages (IISH) Institutions & Agency (UU) Sustainability (UU)
Industrial Revolution 1086 Black Death
Golden Age Black Death French Occupation
Peak Arab World Ottoman Empire
Results • Charting long-term trajectories of various parts of world economy 1000-2000 • Also Middle East/Ottoman Empire, India, Japan • Transition from Malthusian economy to ‘modern growth’: in North Sea area in two steps: Late Middle Ages (Black Death), ca. 1800 (Industrial Revolution) • Rest of the world: gradual spread of Industrial Revolution • Combination with dataset of income inequality within countries: global inequality
The aim: various dimensions of inequalityGlobal Income Inequality 1820-2000 GDP per capita
GDP and Beyond • OECD: Better Life Initiative: multi-dimensional approach to well-being, resulting a.o. in the How’s Life? report • Clio Infra project, global network of economic historians to measure various dimensions of long-term evolution of world economy 1500-2010.
Well-being and the OECD Better policies for better lives Better measures Subjective well-being Social contact Governance…
Aim of cooperation • Present state-of-the-art estimates on various dimensions of development of well-being in world economy from 1820 to present (“GDP and beyond”) • Contribute to the discussion about the broadening of the welfare concept used to characterize socio-economic development • Indicate relevance of going “beyond GDP”, also in historical analysis
Results • In generalvery strong correlation of each indicator with GDP per capita, thoughlessunequallydistributed • Exceptions: low/negativecorrelations in Inequality, Security, andEnvironmentalqualitydomains • Relationship between GDP per capita and other measures of well-being changes over time
Changing relationship • 19th century: early growth paradox • Rapid industrialization and growth did not result in increased well-being • Early urbanization and industrialization had strong negative externalities • Standard of Living debates • Changes after about 1870
Changing Relationship • After 1950: increases in well-being become (increasingly) autonomous • Africa after 1970; Latin America 1980s; Japan after 1990: slowdowns of economic growth do not necessarily result in slowdown increase well-being • Different ranking of western Europe and Offshoots • Relevant for Europe after 2007?
Segmented relation per capita GDP & combined wellbeing indicators
New results • Changing link between GDP per capita and Income Inequality • 19th century: rich countries are more unequal (have larger surplus that can be distributed) • After 1980: poor countries are more unequal • Rich countries went through ‘egalitarian revolution’ • Recent increase in inequality (after 1980) more marked in poor countries
But why? • Explain success and failure in world economy • Institutions versus Geography • Agency
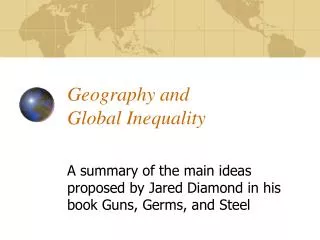
Jared Diamond: Guns, Germs and Steel Importance geography: Why did Neolitihic revolution start in Middle East? EurAsia: easy spread crops and ideas: first cities, states, iron technology
Daron Acemoglu en James Robinson Institutions: extractive versus inclusive Reversal of Fortune 1500-present (Peru versus North America)
Amartya Sen • Development as Freedom • Capabilities approach • Agency enhances economic development • Female Agency: smart economics • Quality-Quantity switch
Institutions as explanation • New Institutional Economics (North, Acemoglu & Robinson) most promising explanation of such trends • Institutions: ‘rules of the game’ of society: informal (customs) vs. formal (laws) • Determine how people interact • Related to trust • Embedded in culture, religion
Institutions and power • Institutions are related to power • They determine who are powerholders and how much power they have, and whether it is constrained or not • At various levels: the state, the firm, the family • NIE: power structures determine economic development (Acemoglu & Robinson)
How to test these ideas • Example: did female agency matter • Classification family systems on basis of antropological data • Inheritance, monogamy/polygamy, consensus/arranged marriage, nuclear/extended families • Female-friendly index Eurasia