Download
1 / 24
240 likes | 390 Views
Inferring Nonstationary Gene Networks from Temporal Gene Expression Data. Hsun-Hsien Chang 1 , Jonathan J. Smith 2 , Marco F. Ramoni 1 1 Children’s Hospital Informatics Program, Harvard-MIT Division of Health Sciences and Technology, Harvard Medical School 2 Department of Mathematics,

E N D
Inferring Nonstationary Gene Networks from Temporal Gene Expression Data Hsun-Hsien Chang1,Jonathan J. Smith2, Marco F. Ramoni1 1Children’s Hospital Informatics Program, Harvard-MIT Division of Health Sciences and Technology, Harvard Medical School 2Department of Mathematics, Massachusetts Institute of Technology IEEE Workshop on Signal Processing Systems October 7, 2010
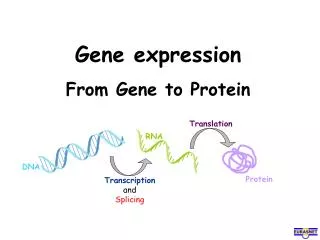
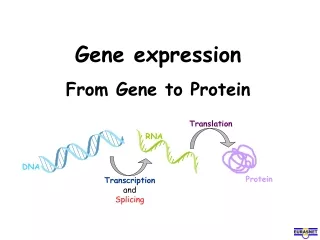
Background • Genetic information flows from DNA to RNA through transcription. • Gene expression is the measure of RNA abundance in cells, revealing the gene activities. • Modern microarray technologies are able to assess expression of 50K genes in parallel.
gene expre. . . . T0 T1 T2 T3 T4 T5 Clinical Applications Multiple patients in distinct biological conditions. • Thanks to cost down, more samples can be collected in a single study. A new clinical application: • Monitor time-series gene expression in response to drugs, treatments, vaccines, virus infection, etc.
gene on gene off Time-Series Gene Expression Analysis • Since genes interact each other in cells, an intriguing analysis is to infer gene networks: • Detailed models (e.g., differential equations). • Abstract models (e.g., Boolean networks). • Probabilistic graphical models (e.g., dynamic Bayesian networks). • Do not require densely sampled data. • Model expression levels by random variables to handle noisy expression measurements and biological variability. • Utilize the inferred networks to make prediction.
A C B D E XT ZT+1 YT XT given predicted ZT+1 YT Data Representation by Bayesian Networks • Bayesian networks are directed acyclic graphs where: • Nodes correspond to random variables (i.e., expressions of genes, clinical variables). • Directed arcs encode conditional probabilities of the target (child) nodes on the source (parent) nodes. • Dynamic Bayesian networks with arcs indicating temporal dependency. • Example: variables X and Y at time T modulate variable Z at time T+1. • The network model can serve as a prediction tool.
Network Inference Engine • First-order Markov process: data at time T+1 depends only on the preceding time T. • For a variable at a time T+1, search which set of variables at time T has the highest likelihood of modulating its value at T+1. • Step-wise search algorithm. Clinical variable VT VT+1 AT AT+1 BT BT+1 CT CT+1 Genes NT NT+1
VT+1 VT+2 AT+1 AT+2 BT+1 BT+2 CT+1 CT+2 NT+1 NT+2 Inference of Whole Dynamic Gene Network • Infer a transition network between every pair of times. VT AT BT CT NT
VT+1 VT+1 VT+2 VT+2 VT AT+1 AT+1 AT+2 AT+2 AT BT+1 BT+1 BT+2 BT+2 BT CT+1 CT+1 CT+2 CT+2 CT NT+1 NT+1 NT+2 NT+2 NT Parallelize Learning Individual Transition Nets
VT+1 VT AT+1 AT BT+1 BT CT+1 CT NT+1 NT Parallelize Parent Searching of Individual Variables
VT VT VT+1 VT+1 VT+2 VT+2 VT+1 AT AT AT+1 AT+1 AT+2 AT+2 AT+1 BT BT BT+1 BT+1 BT+2 BT+1 BT+2 CT CT CT+1 CT+1 CT+2 CT+1 CT+2 NT NT NT+1 NT+1 NT+1 NT+2 NT+2 Step-by-Step Prediction given data given data predicted predicted
VT VT VT+1 VT+1 VT+2 VT+2 AT AT AT+1 AT+2 AT+2 AT+1 BT BT BT+1 BT+1 BT+2 BT+2 CT CT CT+1 CT+1 CT+2 CT+2 NT NT NT+1 NT+2 NT+2 NT+1 Forecasting by Initial Data given data predicted predicted
viral load gene expre. . . . 1 2 4 12 24 Enroll Clinical Study: HIV Viral Load Tracking • Global AIDS epidemic is one of the greatest threats to human health, causing 2 million deaths every year. • Viral load (i.e., virus density in blood) is: • associated with clinical outcomes. • an indicator of which treatment physicians should provide. • If there is a tool to predict/forecast viral load trajectory, physicians could foresee how patients progress to AIDS and could allocate the best treatments upfront. • Data: Fourteen (12 Africans, 2 Americans) untreated adult patients during acute infection.
Accuracy of HIV Viral Load Tracking • Prediction accuracy: • Forecasting accuracy:
Conclusions • A Bayesian network framework to infer dynamic gene networks from time-series gene expression microarrays: • Does not require densely sampled microarray data. • Able to handle noise and handle biological variability. • Temporal dependency is captured by first-order Markov process. • The optimal network model is achieved by parallelized search algorithm. • Application to HIV viral load tracking shows how our method can be used in clinical studies: • Our network model tracks viral load trajectories with higher accuracy than viral load auto-regressive model. • Our model provides candidate gene targets for drug/vaccine development.
Acknowledgements Supported by Center for HIV/AIDS Vaccine Immunology (CHAVI) # U19 AI067854-06: National Institute of Allergy and Infectious Diseases (NIAID) National Institutes of Health (NIH) Division of AIDS (DAIDS) U.S. Department of Health and Human Services (HHS)
VLT+2 VLT+3 VLT+1 VLT+2 VLT+2 AT+2 AT+3 AT+1 AT+2 AT+2 BT+2 BT+3 BT+1 BT+2 BT+2 CT+2 CT+3 CT+1 CT+2 CT+2 NT+2 NT+3 NT+1 NT+2 NT+2 Stationary Network Inference • All networks between pairs of times are identical. VLT VLT+1 AT AT+1 BT BT+1 CT CT+1 NT NT+1
Interferon Family Dominates 3 pathways; 2 pathways; 1 pathway