Download
1 / 38
380 likes | 407 Views
This study from UC Irvine examines how cooking different foods affects indoor air quality, focusing on PM and CO levels. Findings show significant variations based on food types cooked. Future research should explore dietary modifications and further quantify pollutant contributions.

E N D
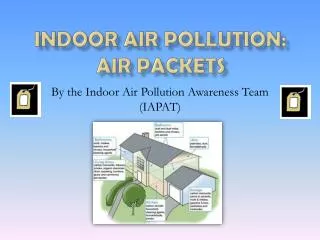
“Killing you softly”Indoor air pollution: is cooking the cause? University of California, Irvine School of Social Ecology Rafael Rodriguez-Leal, Undergraduate Research SymposiumMay 13 2006
The Question • Since most families cook different items with fire stoves, we analyzed the contribution of each meal, within the 95 percentile of peaks of PM and CO. • We undertook this task by examining what items were cooked, and their contribution to pollutant concentrations, at the time they were cooked.
The population under study consumes a diversity of food types. • The diet of the participants Consists of mainly beans, eggs, meat, and tortillas.
Definition of Terms • PM: Particulate Matter • CO: Carbon Monoxide • Fdtype: Type of ingredient cooked • 95 Percentile: The 5th % of the highest pollutant concentrations
Hypothesis • H0: There won’t be a relationship between food items being cooked and pollutant levels regardless of fdtype • H1: There will be a relationship between food items being cooked and pollutant levels, and they will vary according to fdtype
Methods • Our sample consisted of 53 households • Continuous measurements of CO and PM levels were taken over 48 hr. periods • A database in Excel was created incorporating the measurements of both pollutants by minute. • A database in Access was created to match cooked fdtypes to the highest pollutant peaks.
Methods • The means of each fdtype were calculated when fdtype matched the 95 percentile in the peak considered • The means of each fdtype matching the 95 percentile for all homes were calculated
Methods • CO was measured in ppm • PM was measured in mg/m^3
Graph fdtype 6=meat, matching 95 percentilePM peak in home 17
Graph fdtype 7=fish, matching 95 percentilePM peak in home 17
Graph fdtype 8=milk , matching 95 percentilePM peak in home 17
Graph fdtype 10=eggs , matching 95 percentilePM peak in home 17
Graph fdtype 2=tortilla, matching 95 percentileCO peak in home 24
Graph fdtype 2=tortilla, matching 95 percentileCO peak meal 2
Graph fdtype 4=beans, matching 95 percentileCO peak in home 64
Graph fdtype 6=meat, matching 95 percentileCO peak in home 91
Graph fdtype 10=eggs, matching 95 percentileCO peak in home 64
Statistics • H1Claim: For the population of homes using fire-stoves, the mean PM levels in 3 fdtype are given by µ≥2. Furthermore, for the population of homes using fire stoves, the mean CO levels in 3 fdtype is given by µ≥ 30. • H0: PM µ<2 and CO µ<30
Statistics • P-value method for testing hypotheses with a significance level of α=0.1
Graph Tortilla’s making Tortilla´s making meal breakfast Milk for children
Conclusions • The present study considers that there is a significant contribution to indoor air pollution levels, caused by the cooking of different fdtypes • There is variation in the concentrations of pollutants emitted, depending on the fdtype being cooked
Further Research Needed • To examine the possibility of a diet modification in the population studied. • Search to what extent the fdtypes that are cooked most of the time, contribute more or less to pollutant concentrations, vs. the fdtypes that aren’t cooked most of the time.
Acknowledgements • Ph.D. candidate Michael A. Johnson • Professor & Adviser Ph.D. Rufus Edwards • Social Ecology Honors Seminar: Professor & Chair Ph.D. Valerie Jenness • Air Pollution Lab Team: Nick Lam, and Erin Milner
CONTACT INFO • Rafael Rodriguez-Leal Torres • Undergraduate • Environmental Analysis & Design • University of California, at Irvine • Social Ecology • rafaelsr@uci.edu • mobile: 949 551 6484
THANK YOU FOR YOUR TIME • YOU HAVE BEEN A TERRIFIC CROUD • YOUR PATIENCE IS APPRECIATED • GOOD LUCK AT THE SYMPOSIUM!!!! • APL ROCKS!!!!!