Download
1 / 18
180 likes | 250 Views
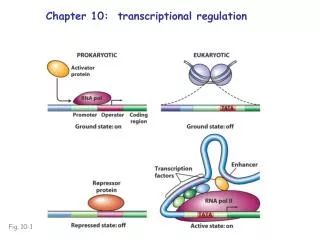
Fig. 10-1. Leaf cross section. Vein. Mesophyll. Stomata. Fig. 10-3. CO 2. O 2. Chloroplast. Mesophyll cell. Outer membrane. Thylakoid. Intermembrane space. 5 µm. Stroma. Thylakoid space. Granum. Inner membrane. 1 µm. Fig. 10-4. 6 CO 2. 12 H 2 O. Reactants:. 6 H 2 O.

E N D
Leaf cross section Vein Mesophyll Stomata Fig. 10-3 CO2 O2 Chloroplast Mesophyll cell Outer membrane Thylakoid Intermembrane space 5 µm Stroma Thylakoid space Granum Inner membrane 1 µm
Fig. 10-4 6 CO2 12 H2O Reactants: 6 H2O 6 O2 C6H12O6 Products:
CO2 H2O Light NADP+ Fig. 10-5-4 ADP + P i Calvin Cycle Light Reactions ATP NADPH Chloroplast [CH2O] (sugar) O2
1 m (109 nm) 10–3 nm 10–5 nm 103 nm 1 nm 106 nm 103m Micro- waves Radio waves Gamma rays X-rays UV Infrared Fig. 10-6 Visible light 750 nm 500 600 700 550 650 380 450 Longer wavelength Shorter wavelength Higher energy Lower energy
Light Reflected light Chloroplast Fig. 10-7 Absorbed light Granum Transmitted light
RESULTS Chloro- phyll a Chlorophyll b Absorption of light by chloroplast pigments Carotenoids 400 500 600 700 (a) Absorption spectra Wavelength of light (nm) Fig. 10-9 Rate of photosynthesis (measured by O2 release) (b) Action spectrum Aerobic bacteria Filament of alga (c) Engelmann’s experiment 400 600 500 700
Excited state e– Fig. 10-11 Heat Energy of electron Photon (fluorescence) Photon Ground state Chlorophyll molecule (b) Fluorescence (a) Excitation of isolated chlorophyll molecule
STROMA Photosystem Photon Primary electron acceptor Light-harvesting complexes Reaction-center complex Fig. 10-12 e– Thylakoid membrane Pigment molecules Special pair of chlorophyll a molecules Transfer of energy THYLAKOID SPACE (INTERIOR OF THYLAKOID)
Electron transport chain Primary acceptor Primary acceptor 4 7 Electron transport chain Fd e– Pq 2 Fig. 10-13-5 e– 8 e– e– NADP+ + H+ H2O Cytochrome complex 2 H+ NADP+ reductase + 3 NADPH O2 1/2 Pc e– e– P700 5 P680 Light Light 1 6 6 ATP Pigment molecules Photosystem I (PS I) Photosystem II (PS II)
Primary acceptor Primary acceptor Fd Fd Fig. 10-15 NADP+ + H+ Pq NADP+ reductase Cytochrome complex NADPH Pc Photosystem I ATP Photosystem II
Mitochondrion Chloroplast Fig. 10-16 MITOCHONDRION STRUCTURE CHLOROPLAST STRUCTURE Diffusion H+ Thylakoid space Intermembrane space Electron transport chain Inner membrane Thylakoid membrane ATP synthase Stroma Matrix Key ADP + P i ATP Higher [H+] H+ Lower [H+]
STROMA (low H+ concentration) Cytochrome complex Photosystem I Photosystem II Light 4 H+ NADP+ reductase Light 3 Fd NADP+ + H+ Fig. 10-17 NADPH Pq Pc e– 2 e– H2O O2 1/2 1 THYLAKOID SPACE (high H+ concentration) 4 H+ +2 H+ To Calvin Cycle Thylakoid membrane ATP synthase STROMA (low H+ concentration) ADP + ATP P i H+
Input (Entering one at a time) 3 CO2 Phase 1: Carbon fixation Rubisco 3 P P Short-lived intermediate 6 P 3 P P Fig. 10-18-3 Ribulose bisphosphate (RuBP) 3-Phosphoglycerate 6 ATP 6 ADP 3 ADP Calvin Cycle 6 P P 3 ATP 1,3-Bisphosphoglycerate 6 NADPH Phase 3: Regeneration of the CO2 acceptor (RuBP) 6 NADP+ 6 P i P 5 G3P 6 P Glyceraldehyde-3-phosphate (G3P) Phase 2: Reduction 1 P Glucose and other organic compounds Output G3P (a sugar)
C4 leaf anatomy Mesophyll cell Photosynthetic cells of C4 plant leaf Bundle- sheath cell Fig. 10-19a Vein (vascular tissue) Stoma
The C4 pathway Mesophyll cell CO2 PEP carboxylase Oxaloacetate (4C) PEP (3C) ADP Fig. 10-19b Malate (4C) ATP Pyruvate (3C) Bundle- sheath cell CO2 Calvin Cycle Sugar Vascular tissue
Fig. 10-20 Pineapple Sugarcane C4 CAM CO2 CO2 Mesophyll cell Night CO2 incorporated into four-carbon organic acids (carbon fixation) 1 Organic acid Organic acid Day Bundle- sheath cell CO2 CO2 Organic acids release CO2 to Calvin cycle 2 Calvin Cycle Calvin Cycle Sugar Sugar (a) Spatial separation of steps (b) Temporal separation of steps
H2O CO2 Light NADP+ ADP Fig. 10-21 P + i Light Reactions: Photosystem II Electron transport chain Photosystem I Electron transport chain RuBP 3-Phosphoglycerate Calvin Cycle ATP G3P Starch (storage) NADPH Chloroplast O2 Sucrose (export)