
Uploaded by
colby-james
4 SLIDES
197 VIEWS
40LIKES
Analyzing Data Trends: Comparative Figures Overview**
DESCRIPTION
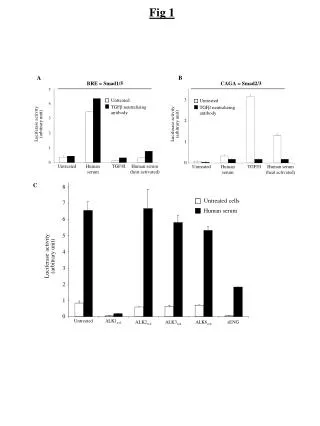
This study presents a comprehensive analysis of data trends as illustrated in Figures 1 through 4. Each figure represents key metrics that highlight important patterns and comparisons. The analysis evaluates the relationships between different data points, providing insights into potential correlations and causative factors. By systematically examining these figures, we aim to draw conclusions that inform strategic decisions and future research directions. This exploration into the visual data representation enhances our understanding of the underlying phenomena.
Download

1 / 4
Download Presentation 
Analyzing Data Trends: Comparative Figures Overview**
An Image/Link below is provided (as is) to download presentation
Download Policy: Content on the Website is provided to you AS IS for your information and personal use and may not be sold / licensed / shared on other websites without getting consent from its author.
Content is provided to you AS IS for your information and personal use only.
Download presentation by click this link.
While downloading, if for some reason you are not able to download a presentation, the publisher may have deleted the file from their server.
During download, if you can't get a presentation, the file might be deleted by the publisher.
E N D


More Related
Audio
Live Player