Download
1 / 34
360 likes | 571 Views
Conference on : Mainstreaming Planning Considerations for Integrating Solar Energy Efficiency in Built Environment 6 th DEC ‘13, . Strategies towards sustainable habitats: A Quantitative approach & Urban environment considerations. Raina Singh & Priyamvada Kayal

E N D
Conference on : Mainstreaming Planning Considerations for Integrating Solar Energy Efficiency in Built Environment 6th DEC ‘13, Strategies towards sustainable habitats: A Quantitative approach & Urban environment considerations Raina Singh & PriyamvadaKayal The Energy and Resources Institute
Agenda • Elements of a Sustainable Habitat • Rating system for Sustainable Habitat Development - GRIHA for Large Developments • Improving energy efficiency: What the future holds… • Developing a framework for Sustainable Habitat development
Elements of Sustainable Habitat Built Environment Buildings Surroundings Optimal allocation of land Choice of materials Transport systems and infrastructure Location of Building Smart Buildings (bldgs. as generators of energy) Environmental management - Water & waste Efficient appliances and fixtures Energy security – renewable sources and energy efficiency
GRIHA-Green Rating for Integrated Habitat Assessment Tool to facilitate design, construction, operation of a green building ,and in turn ….measure “greenness” of a building in India What gets measured gets managed
Genesis GRIHA LD GRIHA android app Capacity building – GRIHA certified Trainers and Evaluators CPWD adopts GRIHA TERI Retreat TERI- GRIHA ECBC • 2000 • 2005 • 2007 • 2007 • 2009 • 2010 • 2011 • 2013 • 2011 • …2000 2001 2008 2009 2011 2012 SVA GRIHA Product catalogue Setting up of ADaRSH Advent of LEED: CII-Sorabhji Godrej Green Business Centre, Hyderabad- Platinum Rated GRIHA adopted by PCMC Over 100 audits NMSH
Variants of GRIHA • SVAGRIHA • GRIHA • GRIHA LD GRIHA Pre-certification Impact of proposed development on the urban scale/surroundings • 100 – 2499 sqm • 2500 – 1,50,000 sqm • > 50 hectare site area New/upcoming projects
Projects which can be rated under GRIHA LD • All projects which satisfy either of the following two thresholds may apply for a GRIHA LD rating: • Total built up area greater than or equal to 1, 50,000 sq.m • Total site area greater than or equal to 50 hectares.
Projects which can be rated under GRIHA LD 1. Large (mixed–use) townships: • Housing complex by builders • Housing complexes by urban development organizations • Housing board and Public Sector Undertaking Townships • Plotted developments with part construction by the developer 2. Educational and institutional campuses 3. Medical colleges and Hospital complexes (eg: AIIMS) 4. Special economic zones 5. Hotels/ resorts
Conventional Rating System GRIHA LD The lower the detrimental impact, the higher the rating The higher the points, the higher the rating
Sections The impact of the development is analysed across 6 sections, which are: • Site Planning • Energy • Water & Waste Water • Solid Waste Management • Transport • Social
Impact in each section The impact in each section is evaluated in two parts: • Quantitative parameters – how much? • Qualitative parameters – how good/bad? The rating of the projects will be done in parts: • Design Stage Rating • Rating of Each Subsequent Stage
Energy balance Sustainable Energy Demand Supply • Energy generation from RE energy • Solar • Wind • Bio Gas • Geo thermal • Day lighting integration in design • Natural ventilation / thermal comfort • Efficient building envelop design • Efficient indoor and external lighting fixtures • Automatic controls • Efficient HVAC systems • Equipment to meet ECBC standards External lighting (Street, landscaping, architectural) Building lighting (Day lighting &Artificial lighting) Building space conditioning Equipment (Transformer/pumps/motors etc.)
Energy Demand Reduction: • Design of energy efficient buildings, energy efficient street lighting, pumping and other site infrastructure facilities. • Reduce the total amount of energy (kWh) required from the local Municipal grid/Diesel gensets by at least 25 per cent. – Mandatory Supply Optimization: • Generation of clean energy on site to reduce the dependence on grid electricity. • Design the development to be self-sufficient in its annual energy requirement. - Optional
Energy- Impact Calculation Base Case Energy Consumption : (B1+E+L1+P) = B kWh x losses Design Case Energy Consumption : (B2+E+L2+P) = P kWh x losses RE Generation : R kWh Net Impact on Grid Electricity : (P-R) kWh % Impact : x 100 where, B1& B2 : Building energy consumption in base & design case respectively E : Equipment and plug loads in the buildings L1 & L2 : St lighting energy consumption in base & design case respectively P : Pumping energy consumption R : Renewable energy generation at site
Benchmarks for Base Case Benchmark for St. Lighting Benchmark for buildings
Input fields without benchmarks Input fields like water pumping etc. do not have a benchmark. The project will calculate the total annual energy being consumed for their respective layout and insert the information in the tool.
Police Training School, Turuchi,Tasgaon • Visibility of green building through implementation of RE • 21.5% of internal lighting annual energy requirements met by renewables. • 28,105 kWh electricity generated from 1kVA of solar power and 13 windmills with power capacity of 5.5kW each. • Energy savings compared to GRIHA benchmark: 31% • GRIHA Rated
University of Petroleum and Energy Studies, Dehradun • 30.1% of internal lighting annual energy requirements met by solar lighting. • 100 kWP Renewable energy installed on site • 95.3% annual energy saved by solar hot water system • Energy savings compared to GRIHA benchmark: 42.7% • GRIHA Rated
Suzlon - One Earth, Pune • Adequate day lighting and glare control measures adopted • 100% desks equipped with LED lights governed by motion sensors. • 154.83 kW Renewable energy installed on site • 250000 units of electricity generated annually. • Energy savings compared to GRIHA benchmark: 47% • GRIHA Rated
Benefits of Efficient Appliances • ~8% electricity savings by 2031 possible in residential sector in alternative efficiency scenarios as compared to BAU • BEE initiative already exists: • Lighting • Refrigerators, AC • Fans & other appliances • Awareness
Building Efficiency / Green Buildings Commercial Sector • Energy consumption is likely to increase 18 times, • With 5-8% of EPI and low carbon intervention saving of 2.5 times is possible by 2030 Hospitals Hospitality Office Education Shops Shopping Malls From 2000- 2030 Area under AC (X 4 times) Area under AC (X 1.2 times) Area under AC (X 2 times) Area under AC (X 3 times) Area under AC (X 2 times) All shopping malls will continue to be AC
Solar Roof Top Potential Estimates • Enough radiation in India • Nearly 58% of the geographical area potentially represent the solar hotspots in the country. • In 2009, TERI estimated, about 7000 MWp of solar rooftop potential can be developed in residential areas alone. • Integrating solar energy on rooftops in building design. • Germany as a Shining example -Houses are net generators of power / Smart homes • Germany produced 22 gigawatts of energy from the sun — half of the world’s total and the equivalent of 20 nuclear power plants. • Incentives like reduction in panel prices by 66% from 2006 • Reverse flow of energy at a prices more than the usual Source: Ramachandraa, T., Jain, R., & Krishnadasa, G. (2011). Hotspots of solar potential in India. Renewable and Sustainable Energy Reviews, 3178–3186. http://www.vnews.com/opinion/5376960-95/column-germany-is-a-shining-example-of-the-benefits-of-solar-power India Energy Security, 2009, TERI
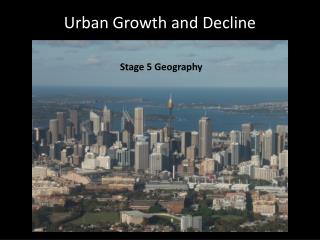
Integrating land use planning in City development Process • Urbanization increasing – no of cities will grow • Integration of land use and transportation plays a major role in reducing the travel demand • Aim should be to create compact cities with travel demand met through PT, IPT and NMT. • Reduce travel demand & distances • Reduce congestion • Improve energy security, environmental impact
Kyoto, Japan • Six action plans in Kyoto • Walkable city, Kyoto • Kyoto-style buildings & forest development • Low carbon lifestyle • Decarbonization of Industries • Comprehensive use of renewable energy • Establishment of a Funding mechanism Source: Japan scenarios and Action towards Low-Carbon Socities (LCSs), MikikoKainuma
Iskandar, Malaysia Low Carbon policy • Residential & commercial Buildings • Energy efficient equipments & appliances • Energy captured from renewable resources • Education and information services • Industries • Energy efficient equipments • Technological transfer • Transportation & Land Use • Alternate fuels & Vehicles • Urban + Transport Planning • Public Transport • Environmental Performance standards (Buildings, Equipments & Vehicles) • Incentives (Subsidies on tax & Loans) Introduction & promotion of energy efficient equipments & buildings Controlled urban growth and modal choice for travel demand Lowering CO2 Intensity Transport demand control Energy efficiency improvement Source: Japan scenarios and Action towards Low-Carbon Socities (LCSs), MikikoKainuma
Singapore: Holistic approach Guiding Principles • Long-Term, Integrated Planning • Policies - from energy to transport to industry and urban planning • Pragmatic and Cost-Effective Manner • Economic growth and a good environment in the most cost-effective • Flexibility • Acceptable to changes in technology and in the global environment. Key Priorities • Encourage Community Ownership and Participation • Business leaders, • non-government organisations • community leaders • Improve Resource Efficiency • can grow with fewer resources • achieve more with less, • reduce costs and free up precious resources • Build Up Our Knowledge • environmentally friendly way, • using technology to overcome our resource constraints • Improve the Quality of Our Environment • controlling pollution • improving physical landscape Source: Sustainable Singapore, Ministry of the Environment and Water Resources, Government of Singapore.
Indian context • Urbanization • No of large cities to increase • Energy security : fuel import dependency, coal dependency increasing • Energy shortages already, low per capita energy consumption; environmental considerations • Sustainable habitats • Integrated planning esp. for cities • Self-sufficient neighborhood
Elements contributing to sustainable habitat • Density:It is the concentration of population, dwelling units, employment or any other variable over a specific area which can be either gross or net • Design: the street network which is pedestrian oriented rather than auto and whose characteristics include side walk, inter connection with in the streets, number of intersection, pedestrian crossing, street lighting • Diversity: It is a measure of variety of land uses present in a given area on the basis of floor area, employment and land area • Distance to transit:the average of the shortest street routes from home or work to the nearest rail stations and bus stops • Destination accessibility:the ease with which one can access the trip attraction to both local (market) and regional (jobs) destinations Source: Travel & Built Environment: A Meta Analysis, Reid Ewing and Robert Cervero
Generalised framework Destination Accessibility Density Design Diversity Distance to Transit Controlled built environment Walkability TransitUse Vehicle Miles Travelled Transit Oriented Development INCREASED DECREASED Lower dependence on non renewable resources (creating energy security) Reduced GHG emissions Source: Travel & Built Environment: A Meta Analysis, Reid Ewing and Robert Cervero