Download
1 / 31
310 likes | 457 Views
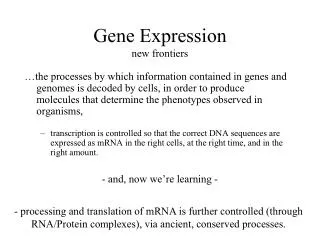
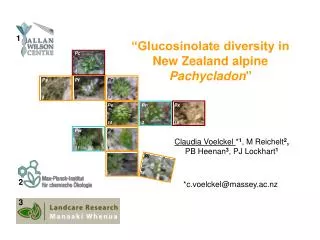
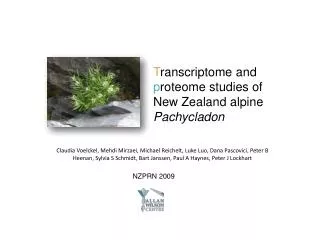
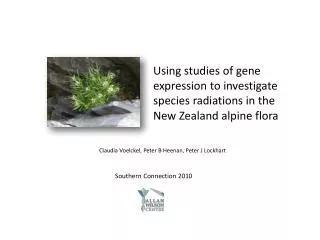
Using studies of gene expression to investigate species radiations in the New Zealand alpine flora. Claudia Voelckel, Peter B Heenan, Peter J Lockhart. Southern Connection 2010. Why Gene Expression Studies?. Genomics. DNA. Transcription. * Evolutionary. Transcriptomics. mRNA. Translation.

E N D
Using studies of gene expression to investigate species radiations in the New Zealand alpine flora Claudia Voelckel, Peter B Heenan, Peter J Lockhart Southern Connection 2010
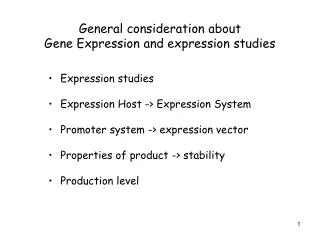
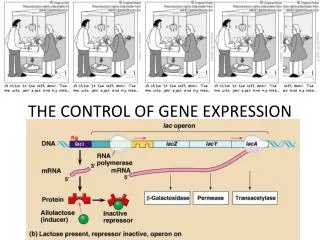
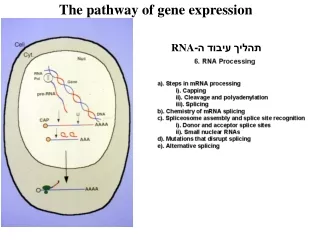
Why Gene Expression Studies? Genomics DNA Transcription * Evolutionary Transcriptomics mRNA Translation Proteomics proteins provide structure & drive metabolism substrate product Metabolomics *Comparative transcript profiling within & between species
Outline Transcriptomics and species radiation – a case study New tool in town – sequencing based methods replace microarrays Putting the new tool to the test – case study revisited Systems biology and species radiation
Outline Transcriptomics and species radiation – a case study New tool in town – sequencing based methods replace microarrays Putting the new tool to the test – case study revisited Systems biology and species radiation
Pachycladon (Brassicaceae) enysii latisiliqua stellatum wallii fastigiatum novae-zealandiae enysii cheesemanii exile Pachycladon super-network, S. Joly, unpubl.
Diversification in New Zealand Alpine Cress Pachycladon fastigiatum Pachycladon enysii vs. Habitat Rosette Habitat Rosette Fruiting Fruiting Flowering Flowering
Sampling in the New Zealand Southern Alps P. fastigiatum P. enysii
Microarrays (DNA chips) DNA chip Sample 1 Sample 2 mRNA mRNA AAAAAA3’ AAAAAA3’ with gene probes AAAAAA3’ AAAAAA3’ TTTTTT5’ TTTTTT5’ red-labeled cDNA TTTTTT5’ green-labeled cDNA TTTTTT5’ DATA ANALYSIS intensity 1 intensity 2 Expression ratio: log
Results • Arabidopsis microarray • (20,468 genes) • 310 genes (1.5%) • up in P. fastigiatum • 324 genes (1.6%) • up in P. enysii • up-regulation of ESM1 and • ESP predict P. fastigiatumto • produce isothiocyanates and • P. enysiito producenitriles P. fastigiatum P. enysii Probability of differential expression ( log odds ratio) ESM1 ESP Magnitude of differential expression (log fold change) Voelckel et al. 2008, Molecular Ecology, 17: 4740–4753
(Aliphatic) Glucosinolates (GLS) – Synthesis and hydrolysis genes CYP79, CYP83, C-S lyase, SGT, SOT Methionine Chain elongation pathway Homomethionine (C3 GLS) GLS core pathway Methylthioalkyl GLS Dihomomethionine (C4 GLS) MAM, MAM-I, MAM-D, BCAT4 FMO Methylsulfinylalkyl GLS AOP2 AOP3 Side chain modification Alkenyl GLS Hydroxalkyl GLS GS-OH Hydroxalkenyl GLS myrosinase Glucosinolate hydrolysis ESM1 ESP Thiocyanates Isothiocyanates Nitriles (Eithionitriles) Oxazolidine-2-thione
HPLC Test of Microarray Prediction Gene Regulation (log ratio) Prediction Test P. enysii • 6.29 • - 4.62 Nitriles inP. enysii Isothiocyanates in P. fastigiata ESP (At1g54040) ESM 1 (At3g14210) HP (μ mol/g fw) P. fastigiata HP (μ mol/g fw) Hypothesis: Role for herbivory in species diversification? Voelckel et al. 2008, Molecular Ecology, 17: 4740–4753
Outline Transcriptomics and species radiation – a case study New tool in town – sequencing based methods replace microarrays Putting the new tool to the test – case study revisited Systems biology and species radiation
NEXT-GEN Sequencing • Inexpensive production of large volumes of sequence data • Several platforms (Roche/454, Illumina/Solexa, ABI/SOLiD) • Many applications (de-novo assembly, re-sequencing, epigenetics • and chromatin structure, metagenomics) • Revolutionary tools for gene expression analysis • (e.g. Tag profiling, RNA-seq)
Tag Profiling AAA3’ AAA3’ AAA3’ AAA3’ AAA3’ AAA3’ AAA3’ AAA3’ Sample 1 mRNA mRNA Sample 2 Solexa Genome Analyzer AAA3’ AAA3’ AAA3’ AAA3’ AAA3’ AAA3’ AAA3’ AAA3’ 18 bp tag library 18 bp tag library TAG MAPPING Reference Sample 1 Sample 2 STATISTICAL ANALYSIS 1 2 2 1 1 1 count 1 count 2 log If needed – build reference transcriptome through RNA seq
Advantages & Challenges of Tag Profiling Advantages • open to any organism • any expressed transcript detectable (1 copy/cell) • less RNA needed (tag profiling = 1µg, microarrays = 100 µg) • minor data normalization/no background Challenges • mapping 18 bp tags (sequence differences Pachycladon/Arabidopsis) • counting tags per gene (noise, location, abundance) • statistical analysis of differential expression (proportion data)
Outline Transcriptomics and species radiation – a case study New tool in town – sequencing based methods replace microarrays Putting the new tool to the test – case study revisited Systems biology and species radiation
Tag Profiling Results • 17423A. thaliana loci • (noise filter 10, count most • abundant tag per gene) • 2654 genes (15.2%) up • in P. fastigiatum • 1857 genes (10.7%) up • inP. enysii • (tagwise normalization, • -log2(1.5) < logfc < log2 (1.5)) P. fastigiatum P. enysii
Microarrays (MA) vs. Tag Profiling (TP) MA: 20,468 genes TP: 17,423 genes 8863 11605 5818 PF 269 41 2613 MA TP PE 274 50 1807 MA TP 2654 up in PF 1857 up in PE 310 up in PF 324 up inPE • more differentially expressed genes in TP (10.7-15.2% ) than with MA (1.5-1.6% ) • 13.2% (PF) and 15.4 % (PE) of MA results confirmed by TP results • biological inferences from both studies identical
Tag Profiling is dead, long live RNA-Seq! One year later: Tag profiling works for a non-model plant with a distant reference transcriptome! Let’s do more experiments! 2 Oct 09: “Illumina is discontinuing the support of Tag Profiling and will no longer be manufacturing the reagent kits for this application.” “...not a popular product, too expensive, tricky chemistry.. instead use: RNA-Seq!”
RNA-Sequencing AAA3’ AAA3’ AAA3’ AAA3’ AAA3’ AAA3’ AAA3’ AAA3’ Sample 1 mRNA mRNA Sample 2 Solexa Genome Analyzer cDNA library cDNA library READ MAPPING Reference Sample 1 Sample 2 STATISTICAL ANALYSIS 1 2 2 1 1 1 count 1 count 2 gene length log If needed – build reference transcriptome through RNA seq
Advantages & Challenges of RNA-Seq Advantages • whole transcriptome coverage and longer reads • large dynamic range of expression levels • base-resolution expression profiles for each gene • multiplex-compatible • sequence variation in transcribed regions (e.g. SNPs) • splicing isoforms, gene boundaries, novel transcribed regions Great for non-model organisms! Challenges • read mapping (reference transcriptome) • quantification of reads (lack of software, but packages evolve: e.g. edgeR)
Planned RNA Sequencing Projects EST library for Pachcladon fastigiatum (31,116 genes, 79% of Arabidopsis) Adaptation to warmer climates in Pachycladon SNP development in Pachycladon Allopolyploidy and genome bias in Pachycladon
Outline Transcriptomics and species radiation – a case study New tool in town – sequencing based methods replace microarrays Putting the new tool to the test – case study revisited Systems biology and species radiation
How about System Biology? Genomics DNA Transcription * Evolutionary mRNA Transcriptomics Translation * Evolutionary proteins Proteomics provide structure & drive metabolism * Evolutionary substrate product Metabolomics *Comparative transcript, protein and metabolite profiling within & between species
Questions & Approach EN LA Q: Ecological drivers of diversification? ST FA A: Comparative gene and protein expression profiling in common gardens WA NZ NZ EN EX EX CH CH P. cheesemanii (CH) P. exile (EX) P. novae-zelandiae (NZ)
People who helped: Peter Heenan Murray Dawson Lincoln Plant growth Michael Reichelt JenaGlucosinolate analysis Sydney Protein analysis Auckland Microarray analysis Paul A. Haynes Mehdi Mirzai Dana Pascovici Bart Janssen Luke Luo Silvia Schmidt Palmy Link all data Submitted Claudia Voelckel Pete Lockhart
Overall correlation: T = transcript profiling, P = protein profiling 9601 loci 1489 loci T TP P 8527 1074 415 P T similar to other non-plant systems (0.2-0.5)
Specific Genes Found by T AND P EX+NZ Interconversion of carbon dioxide and bicarbonate (carbonic anhydrase) T TP P 97 29* 61 Draught response CH 23% 32% Serine racemase CH+NZ T TP P 18 4 81 Draught response EX 18% 4% CH+EX Interconversion of carbon dioxide and bicarbonate (carbonic anhydrase) T TP P 14 8 228 NZ 36% Vegetative storage proteins 3%
Testing Predictions from T& P: Glucosinolate Hydrolysis Prediction Test P. cheesemanii P. novae-zelandiae
Profiling Patterns Through the Phylogenetic Lens: = = Glucosinolates ≠ NZ EX CH
Thanks to: New Zealand Landcare: Peter Heenan, Kerry Ford, Murray Dawson, Kat Trought Plant and Food: Bart Janssen, Luke Luo, Silvia Schmidt AWC Genome Service: Pete Lockhart, Patrick Biggs, Lorraine Berry, Lesley Collins, Maurice Collins Students: Christine Reinsch, Hanna Daniel, Helene Kretzmer Australia Macquarie University: Mehdi Mirzai, Dana Pascovici, Paul Haynes, Mark Westoby Germany MPICE: Michael Reichelt, Jonathan Gershenzon Funding Marsden & Humboldt Foundation YOU!